Efficio Energy Management Functions and Modules
Efficio is one of the leading software solutions for energy management, and the basic version already covers all requirements of a professional energy management system. For even higher demands, a number of functions and modules are available in Efficio that significantly support the certification process according to ISO 50001, DIN 16247-1, and EMAS and ensure customized energy reporting.
Because each business unit has different needs when it comes to energy management, you can select different functions and modules in Efficio. For example, energy managers need to ensure sustainable energy optimization and increase energy efficiency through energy performance indicators (EnPI); controlling needs to determine the exact energy costs as well as distribute energy consumption data to cost centers; and production and maintenance need to monitor production indicators, detect anomalies such as leakages, and leverage savings potential. Powerful modules are available in Efficio that satisfy all of these requirements. Efficio meets the requirements of ISO 50001:2018 and is approved by BAFA as an eligible energy management system.
Efficio Functions and Modules
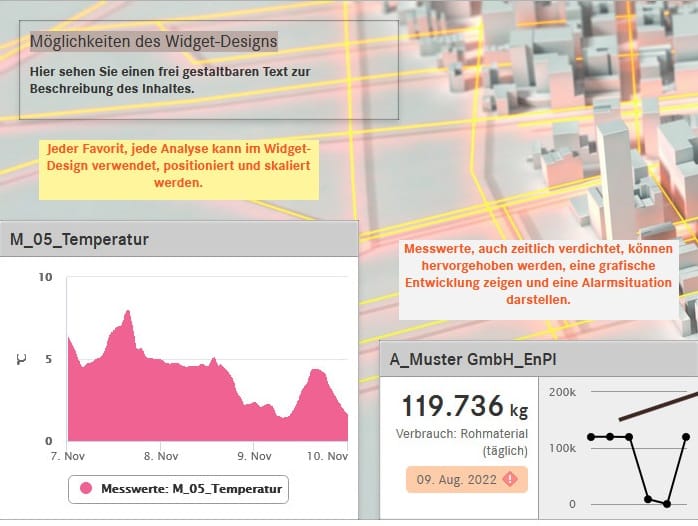
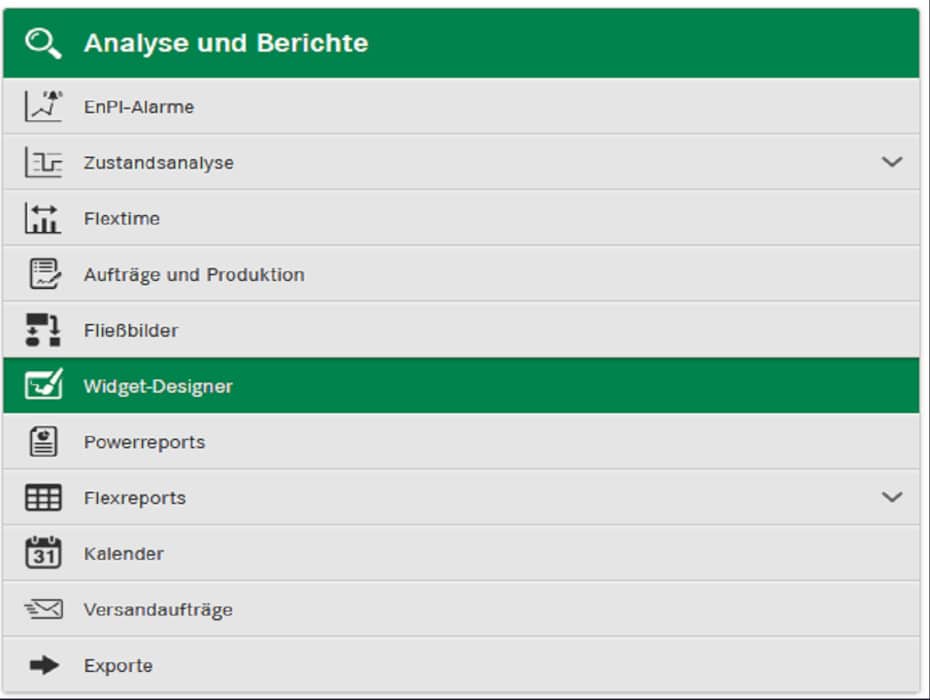
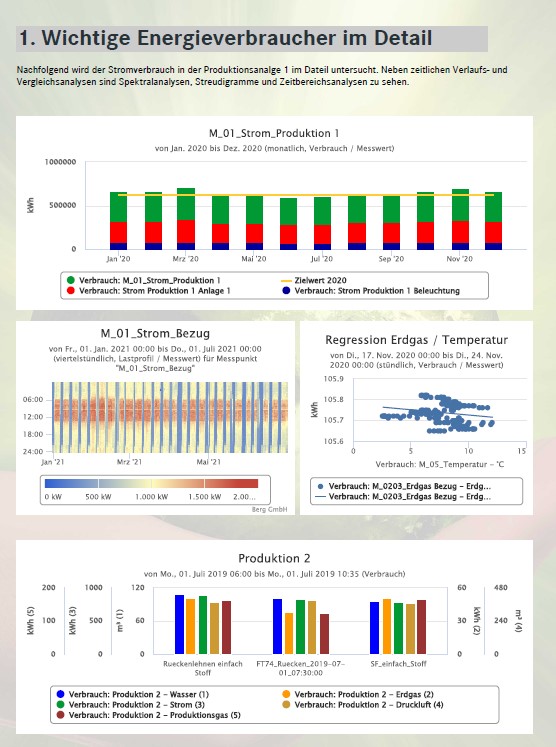
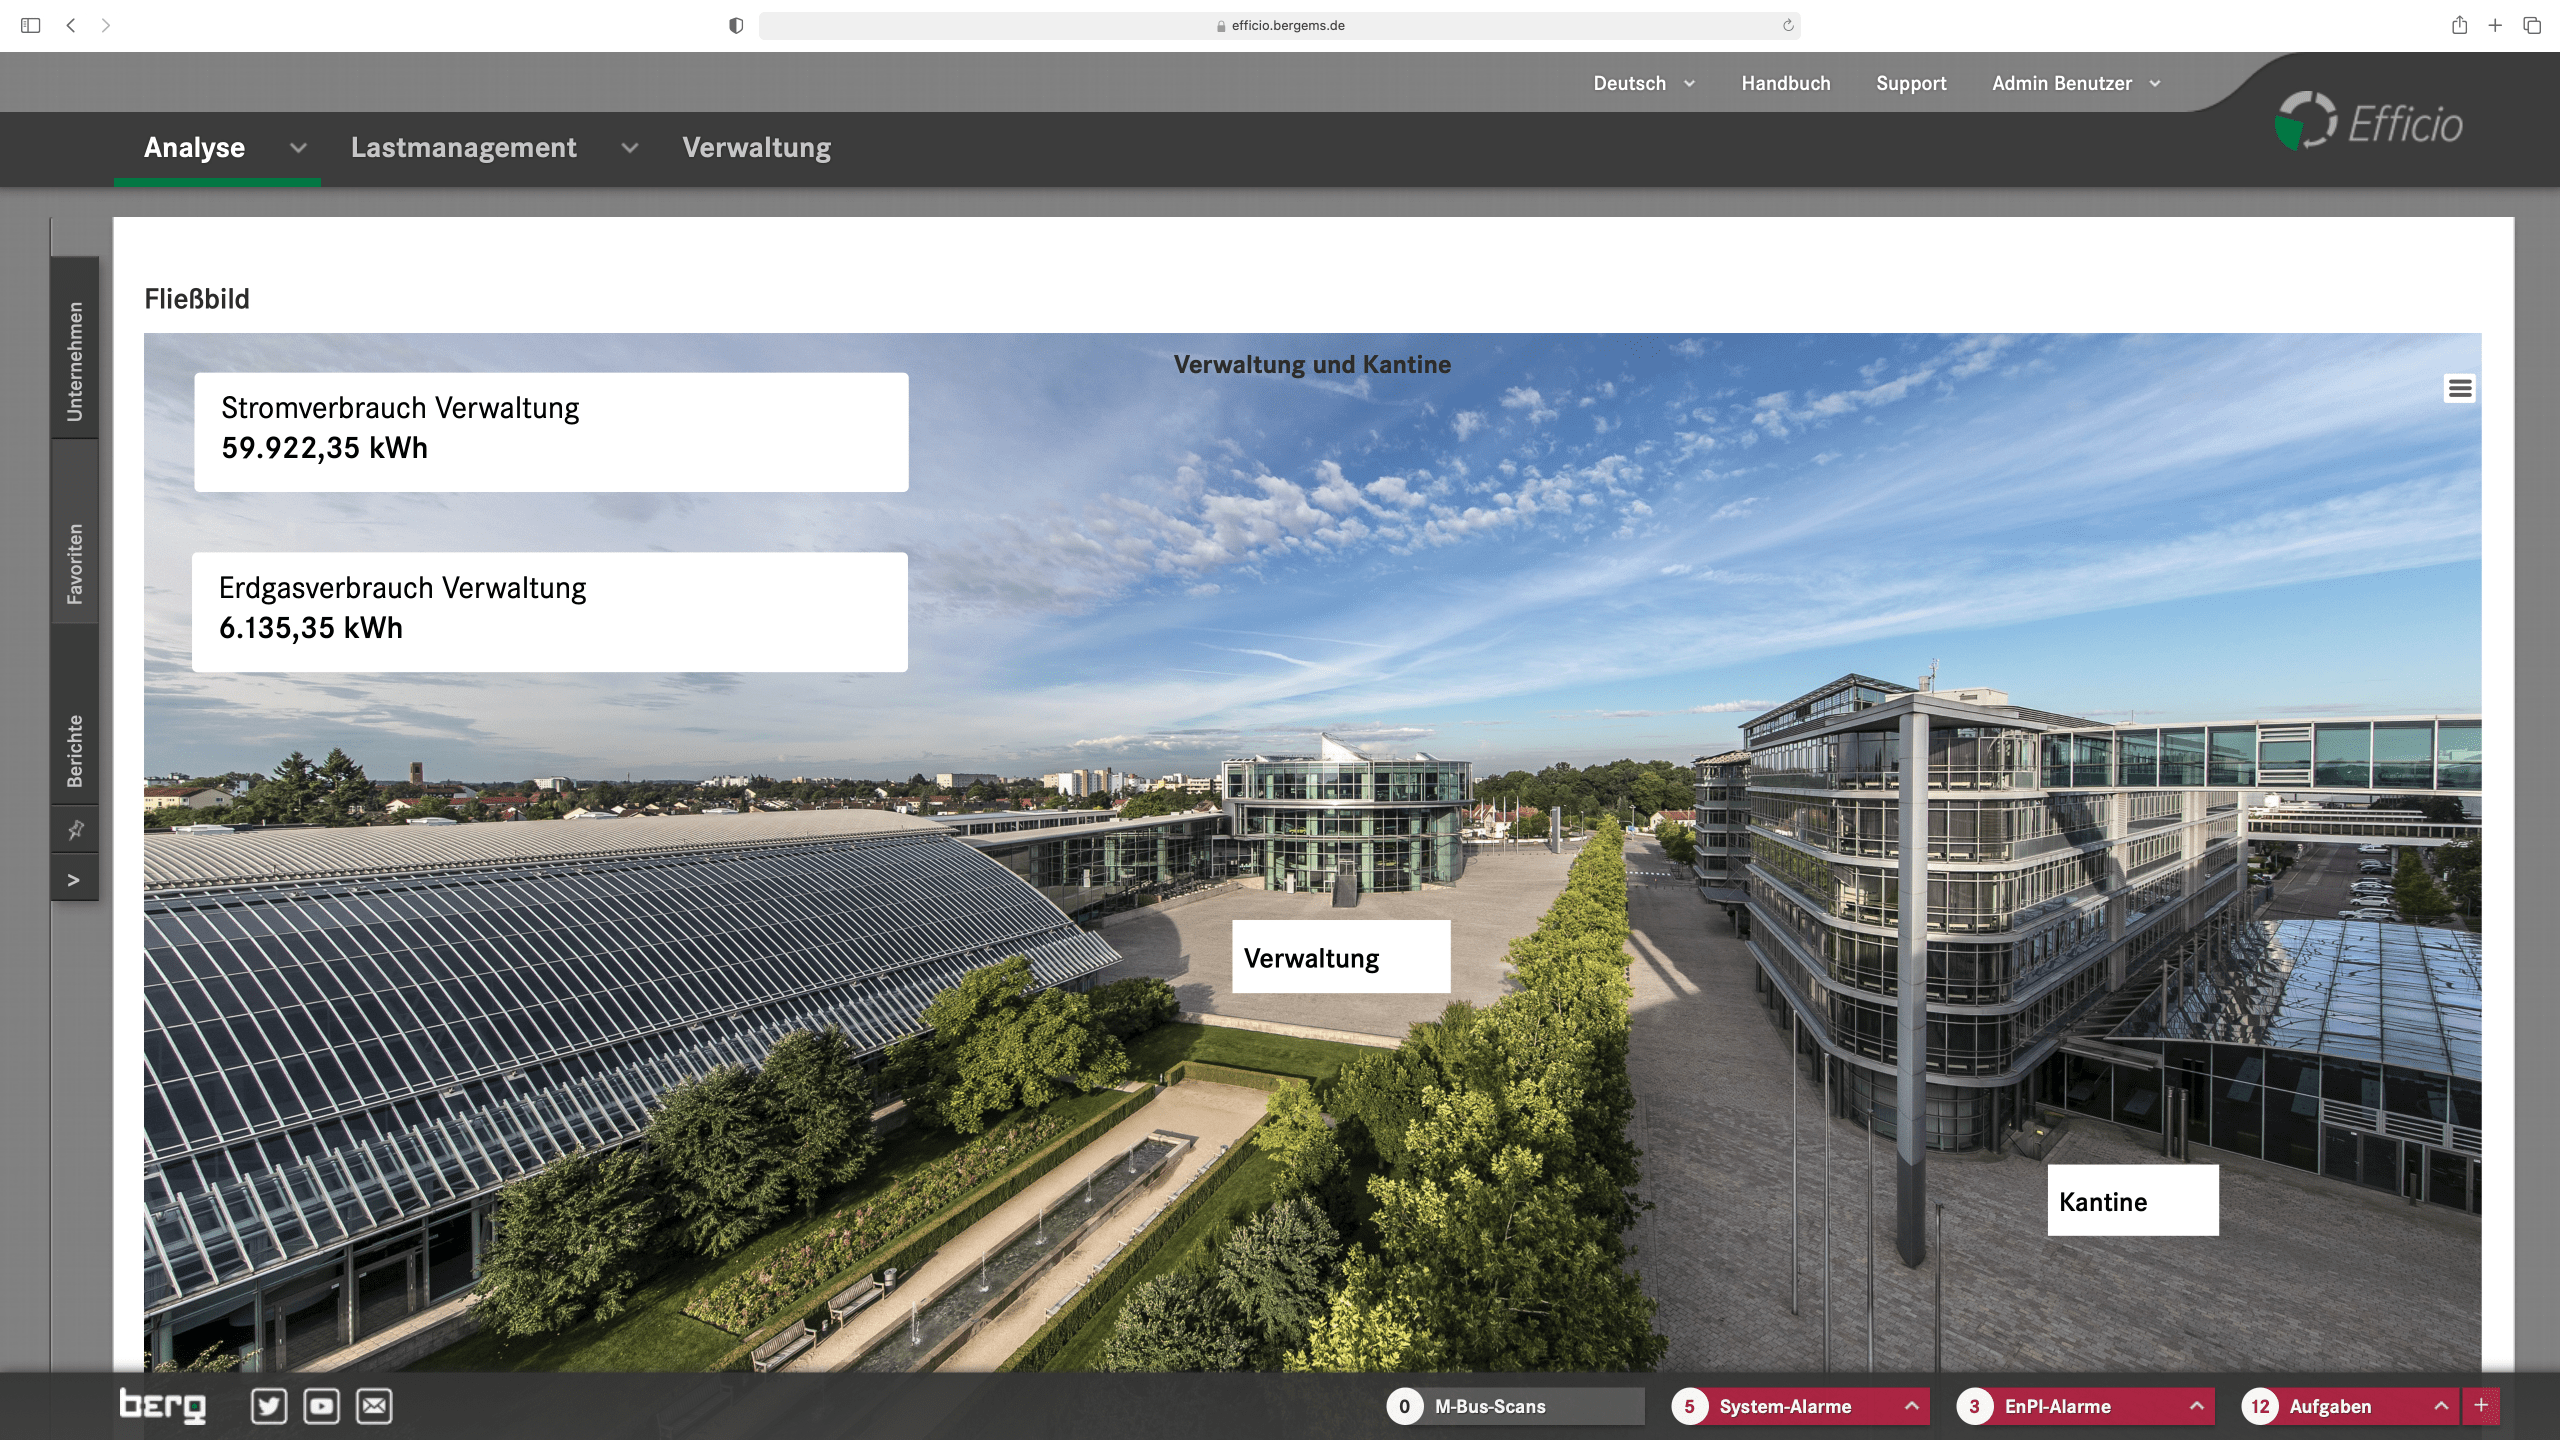
NEW: Module Widget – Designer
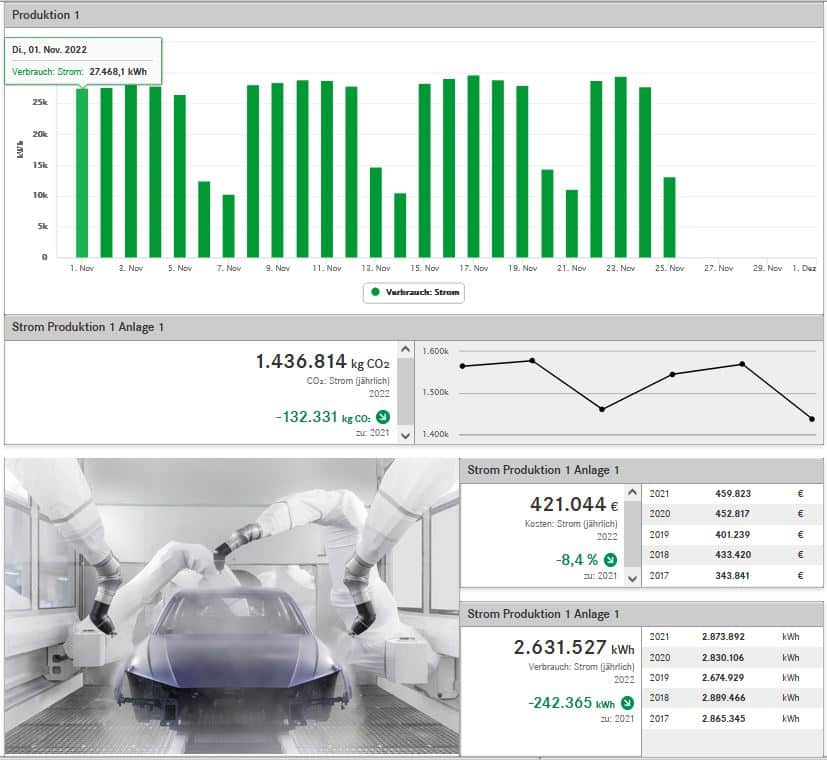
- Visual preparation of live information
- Own design of individual analysis widgets e.g. for production units, properties or flow diagrams
- Display of current values of meters, sensors, costs, CO2 emissions
- Display of value widgets with alarms, trends and histories
- Realization of overviews to detailed areas through links
- Explanatory free texts with WYSIWYG editor and arrows can be inserted quickly and easily
- Use of widget designs for further applications such as dashboards and power reports
Further screenshots
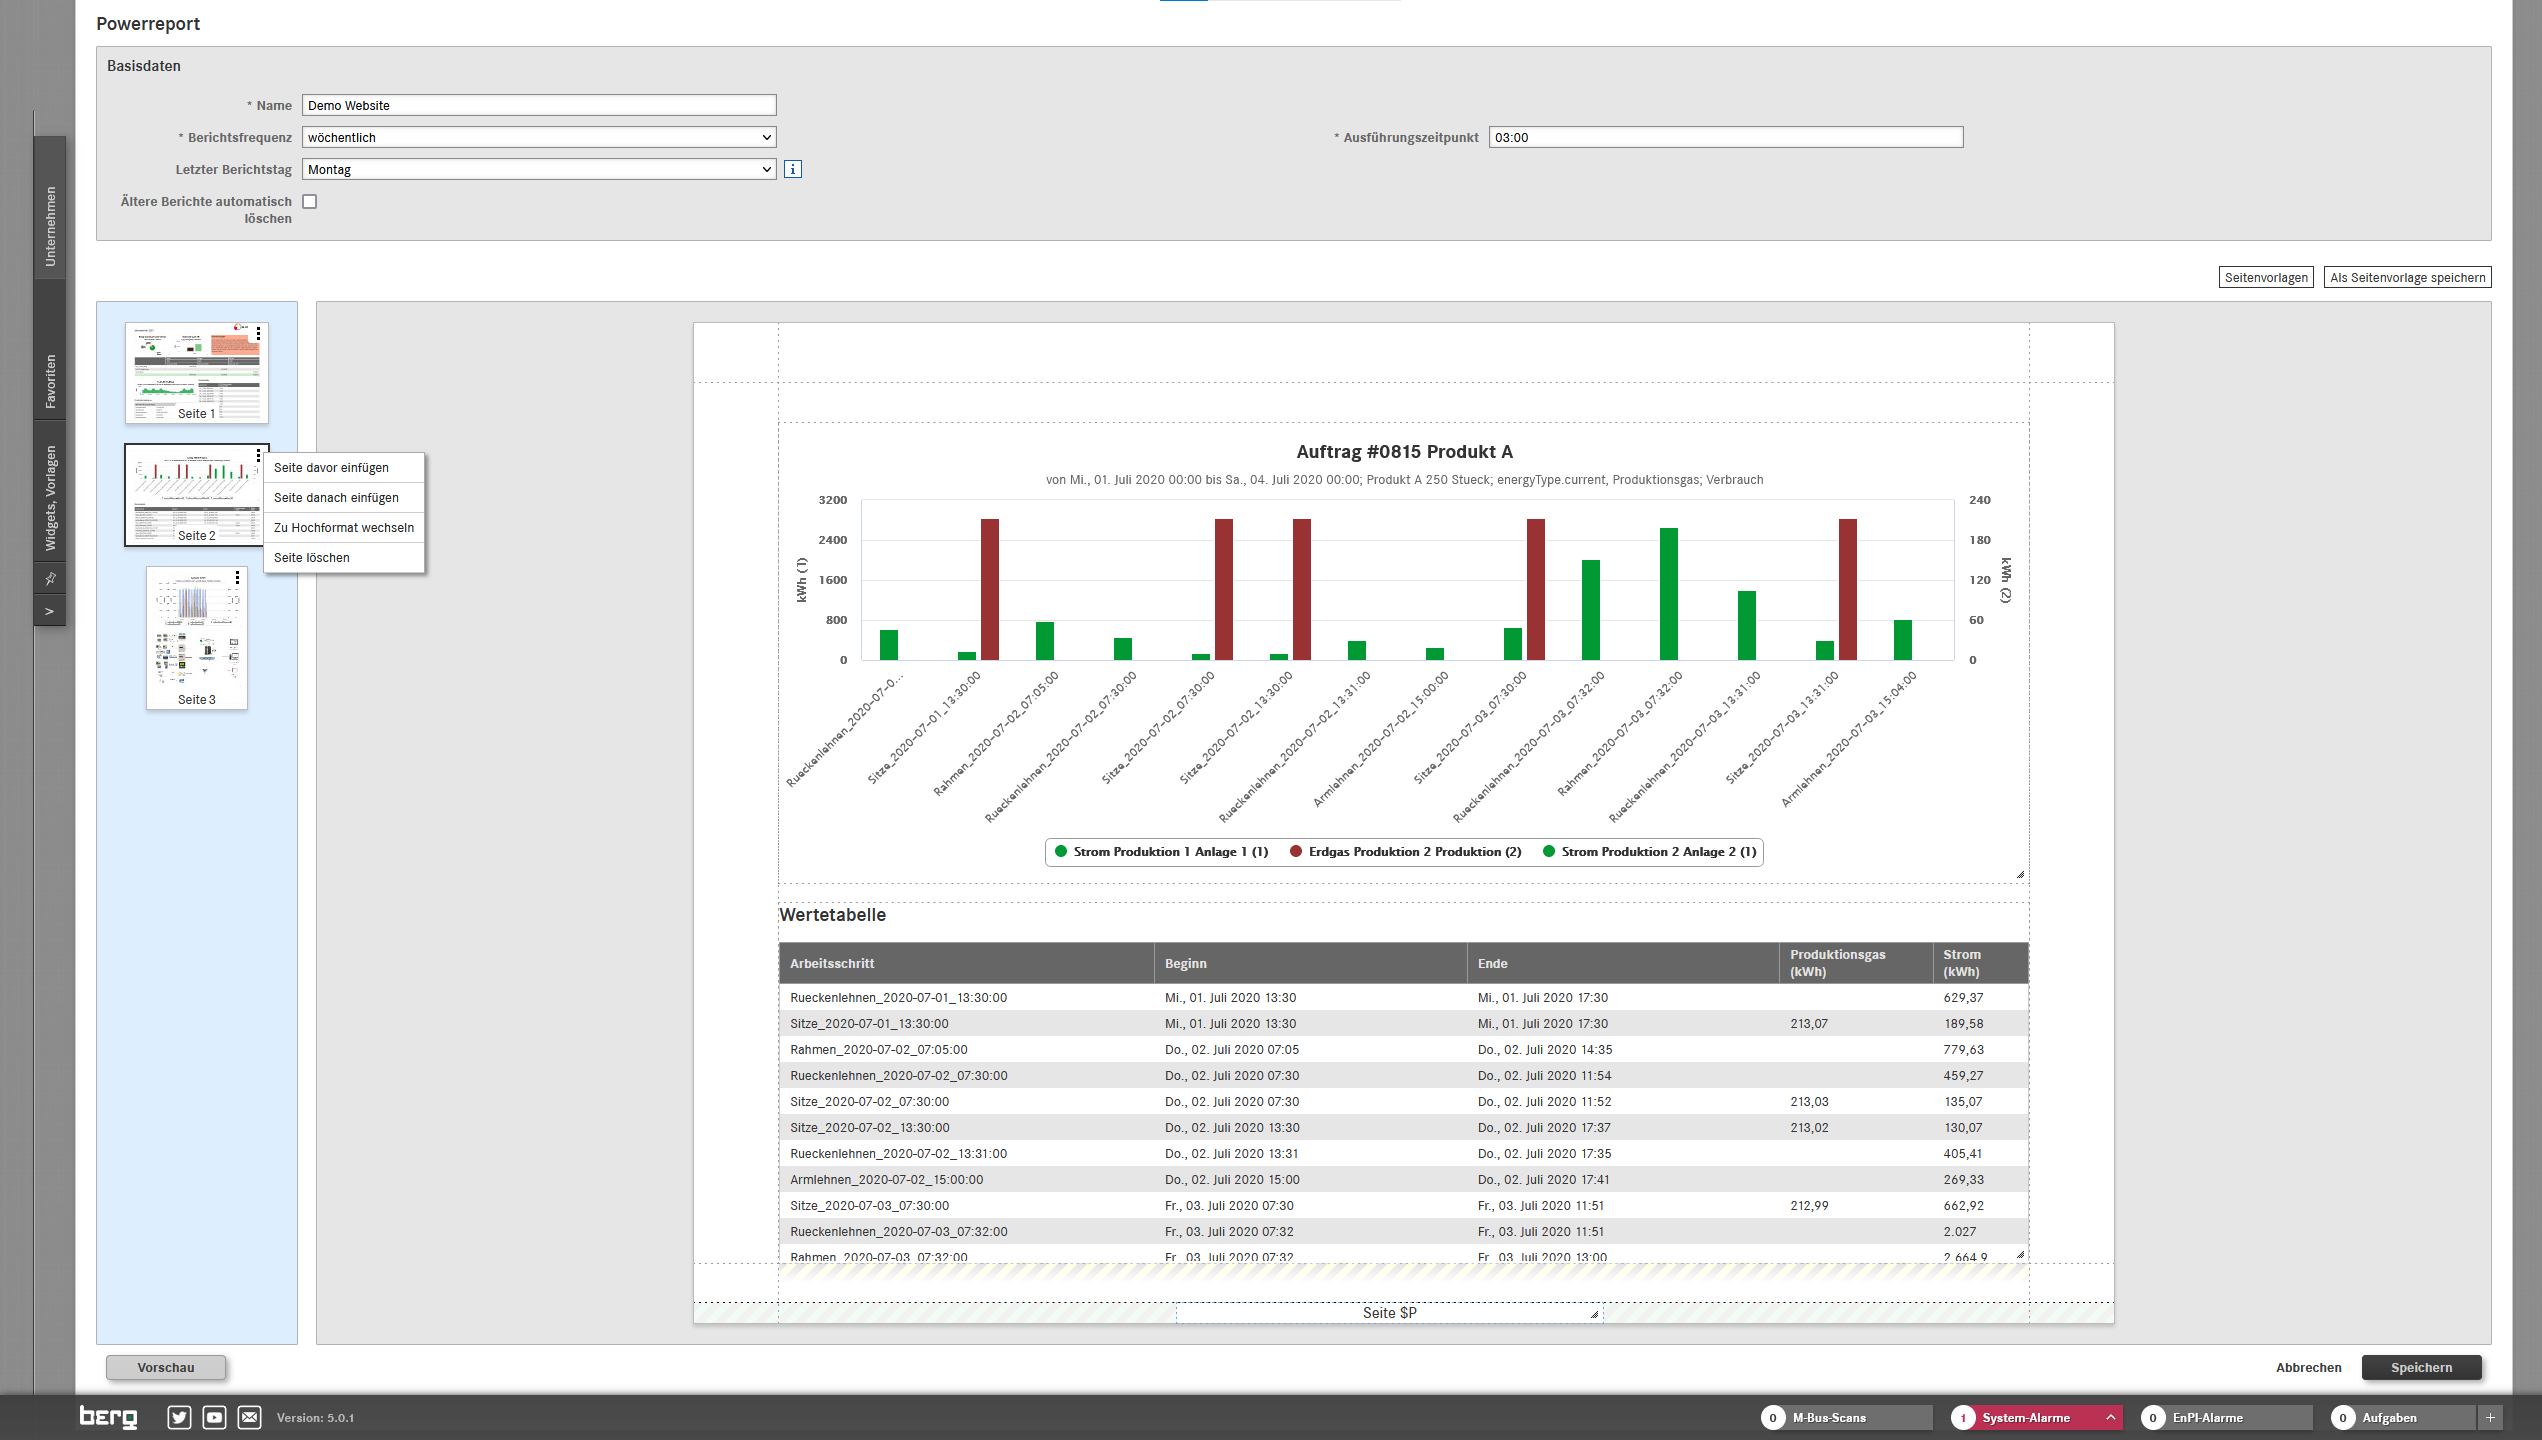
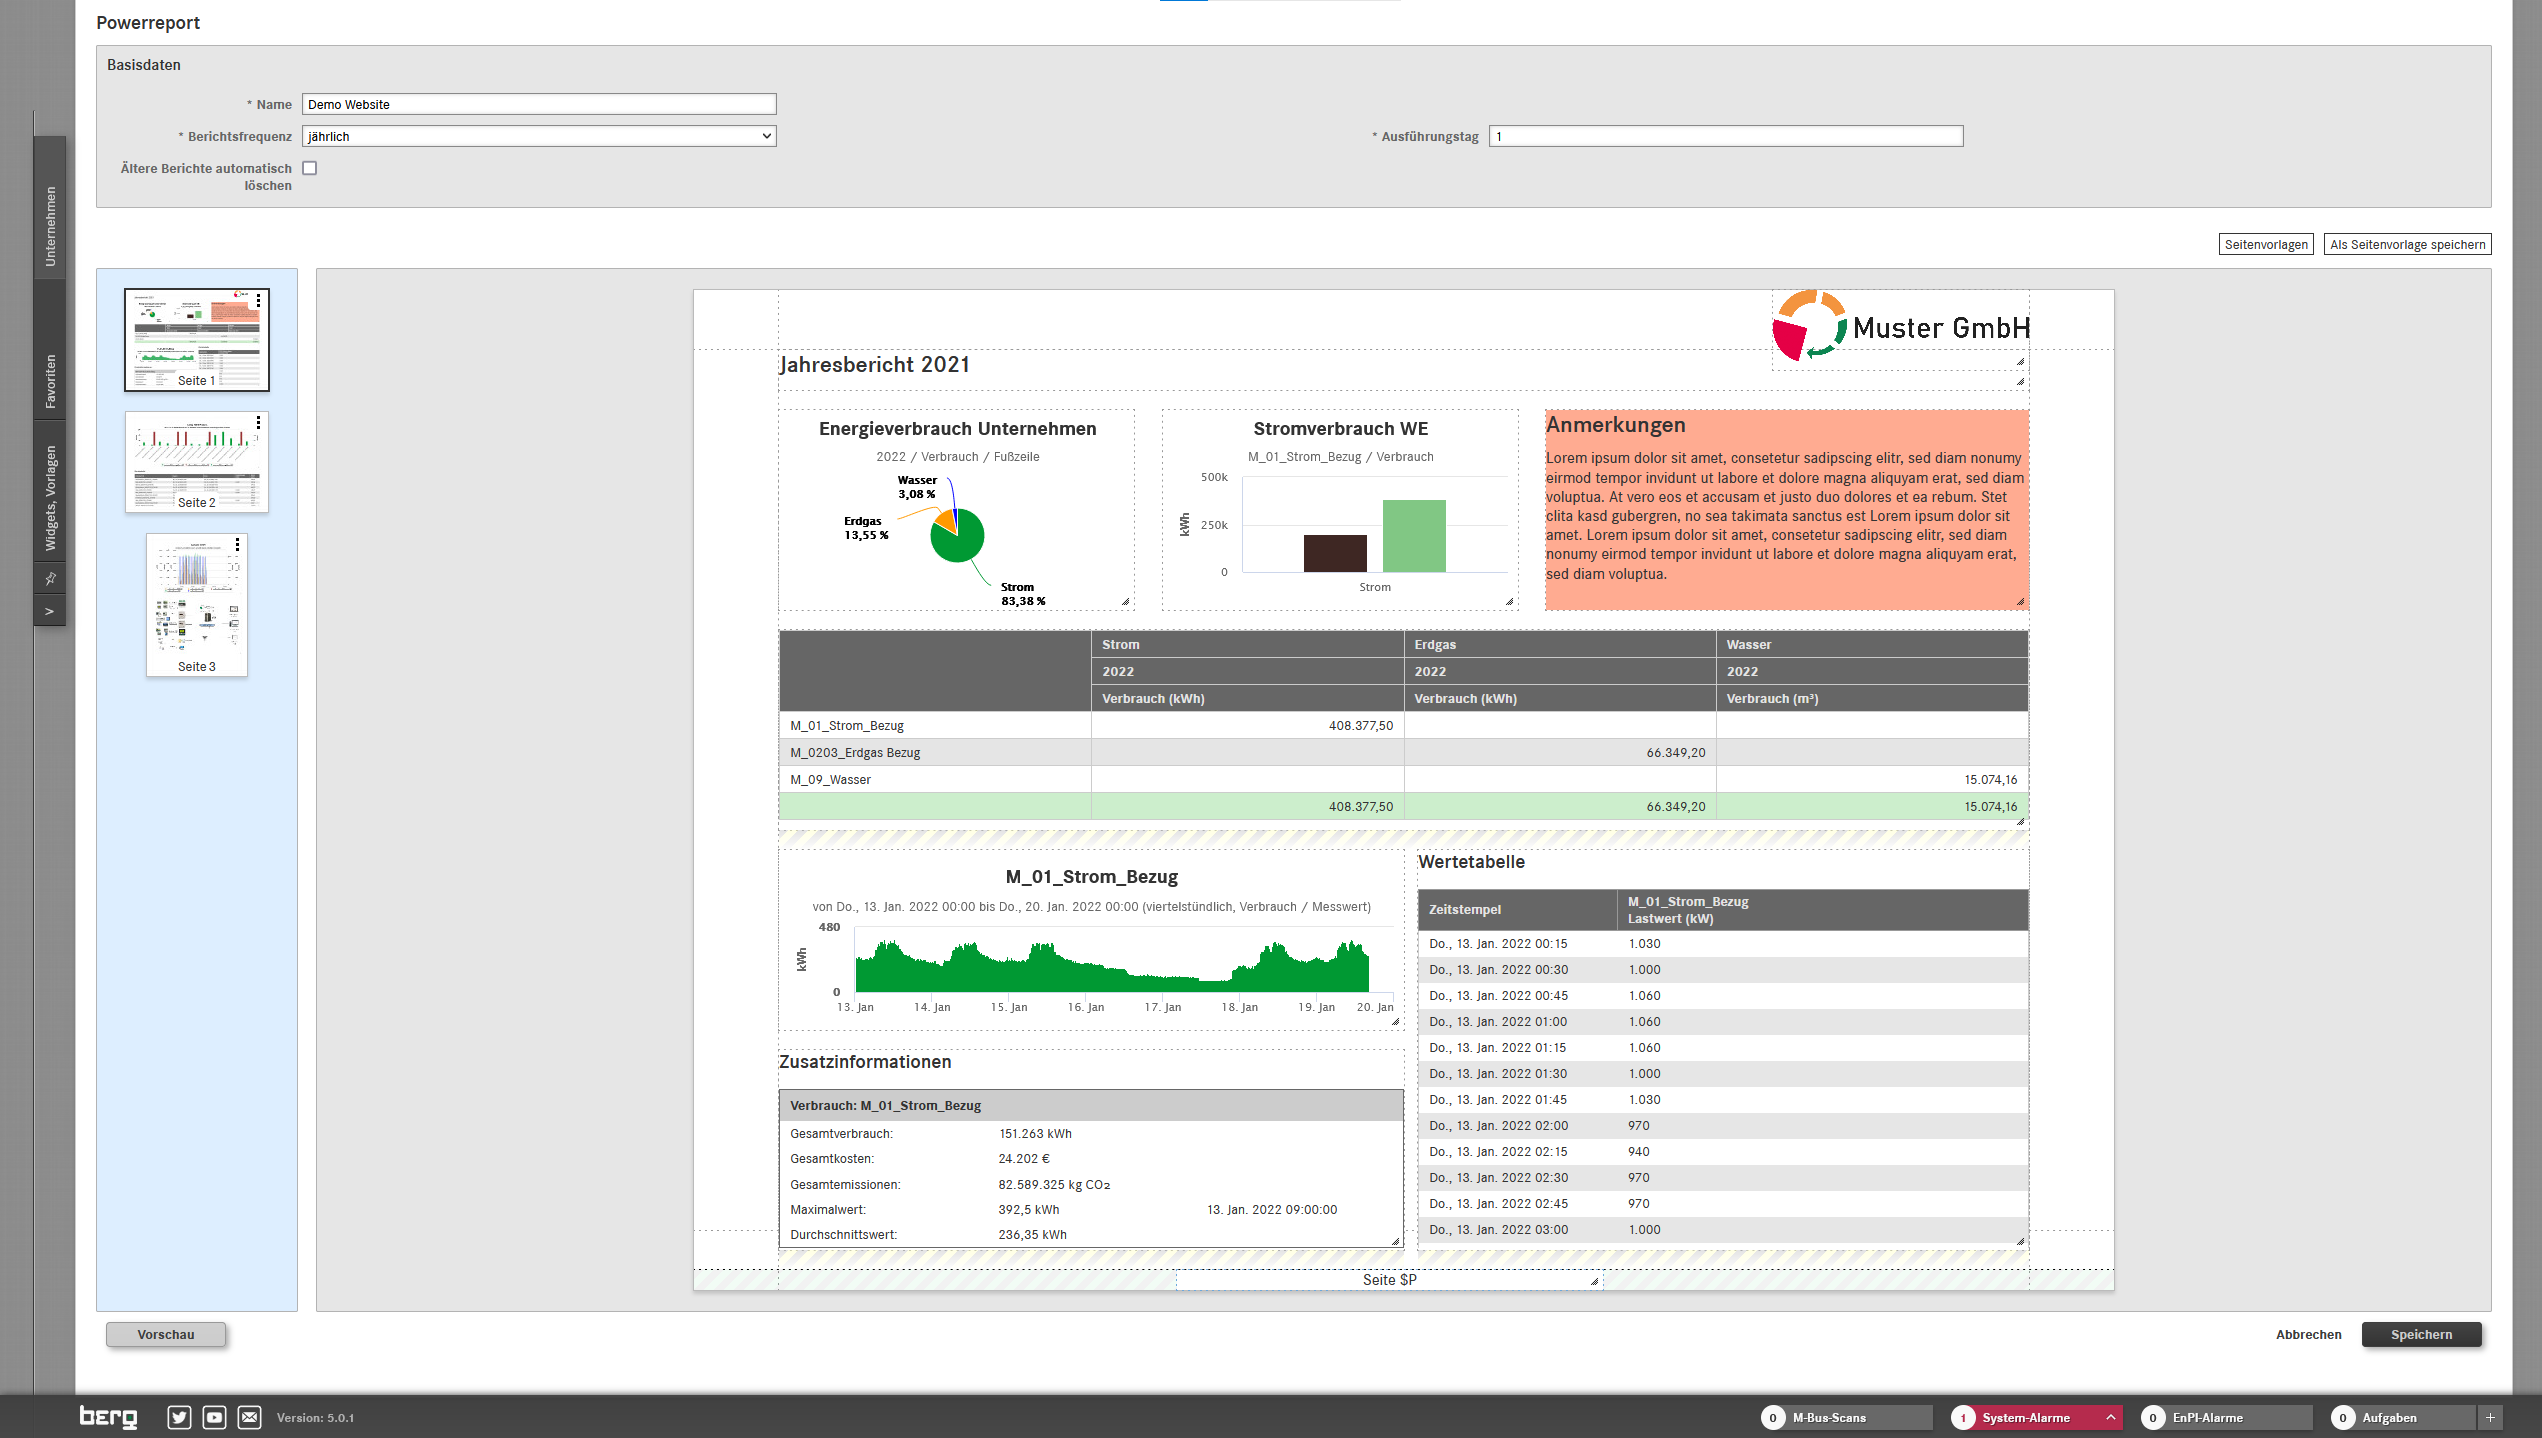
Powerreports module
- Create customized energy reports with the powerful drag-and-drop report generator
- Automatically update report content
- Page templates, headers, footers, and placeholder texts provide simple layouts, adapted to the company’s corporate image
- Insert background images for letter templates or CI design
- Freely position, resize, and overlay analyses, text, and images
- Create page templates for recurring design features and standardized reports
- Save time when creating management review
- Unlimited number of pages and widgets possible
Further screenshots
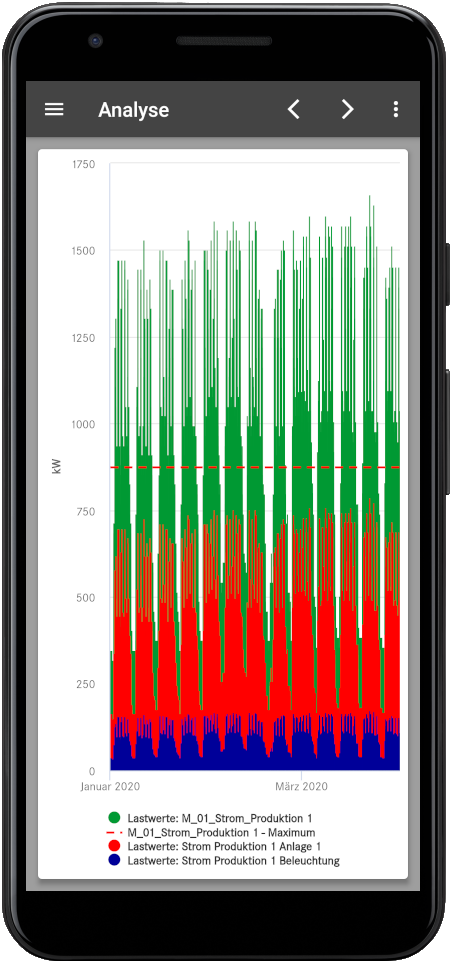
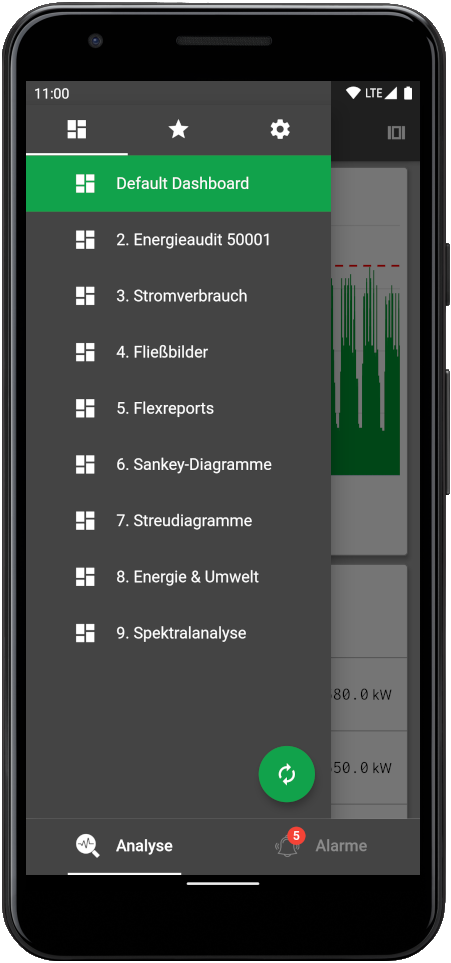
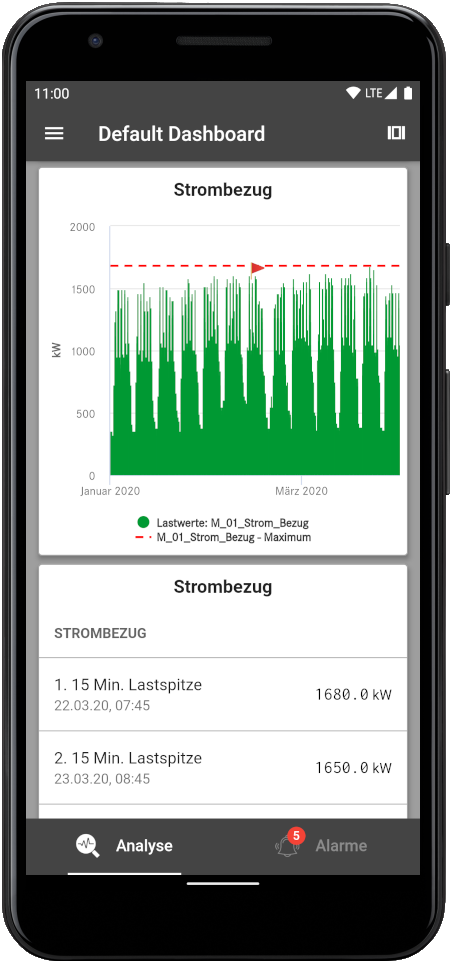
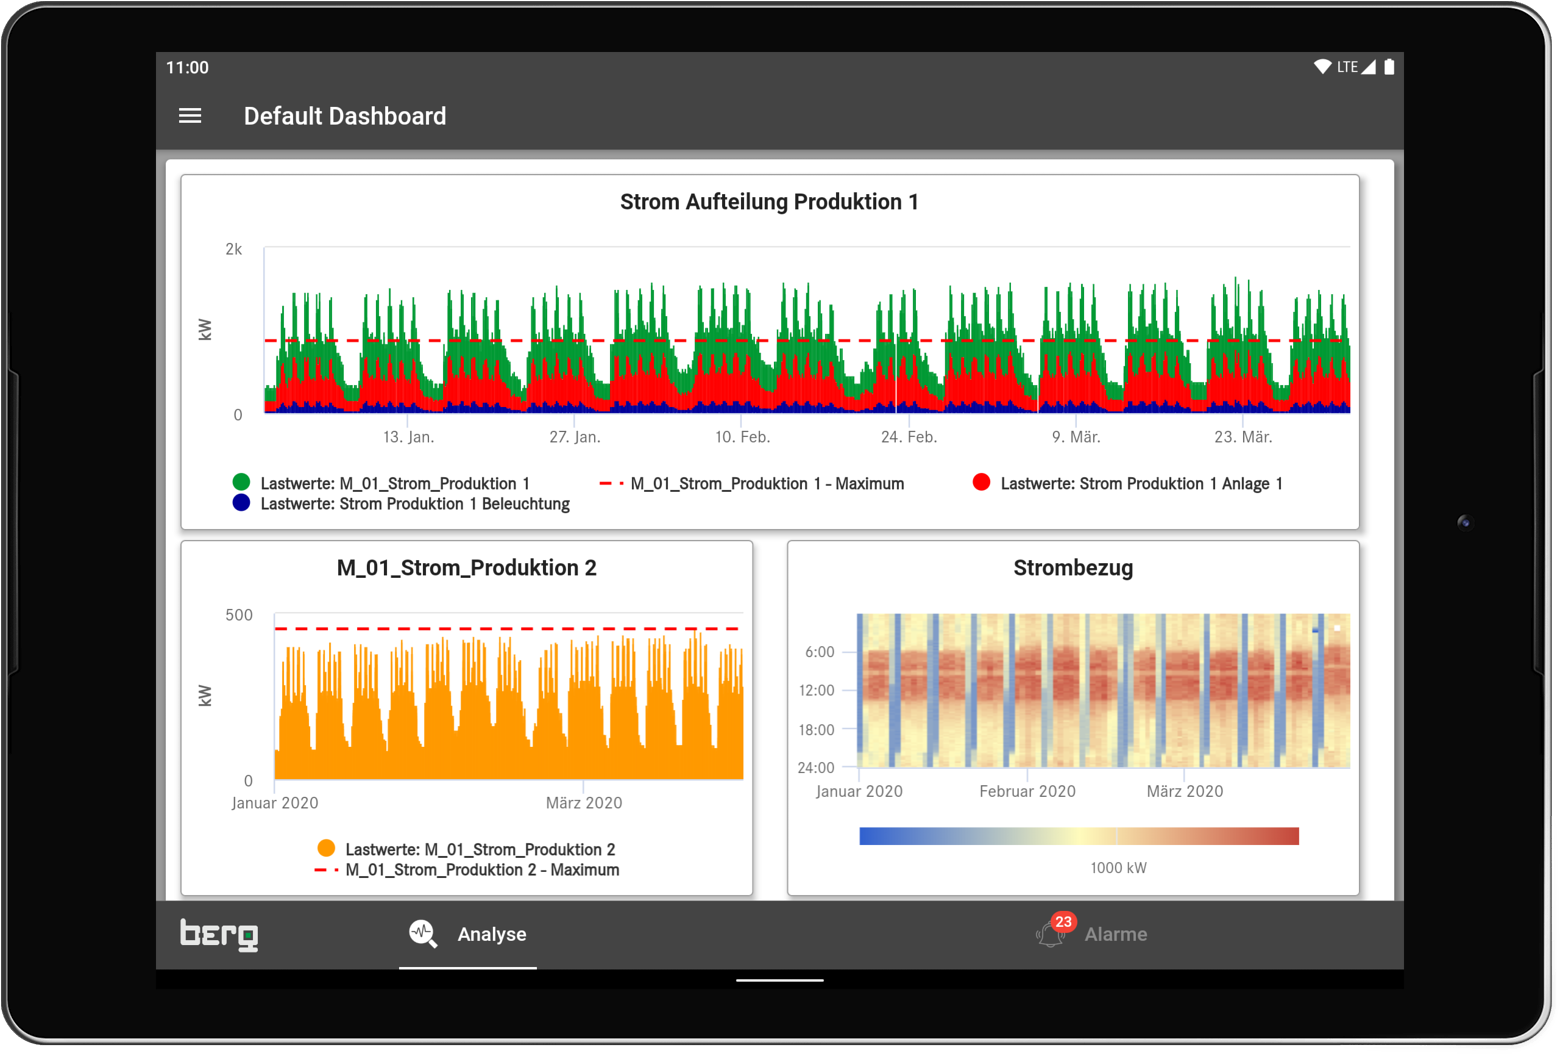
Efficio mobile app
- All dashboards and favorites available on your mobile device
- Also usable without connection to the Efficio server following synchronization
- Full-screen view in vertical mode possible to ensure optimal display even on smaller screens
- Dashboard widgets can be displayed on the smartphone in the original arrangement or as a list
- View and acknowledge current alerts
- App is available for Android and iOS smartphones and tablets
Further screenshots from the mobile app


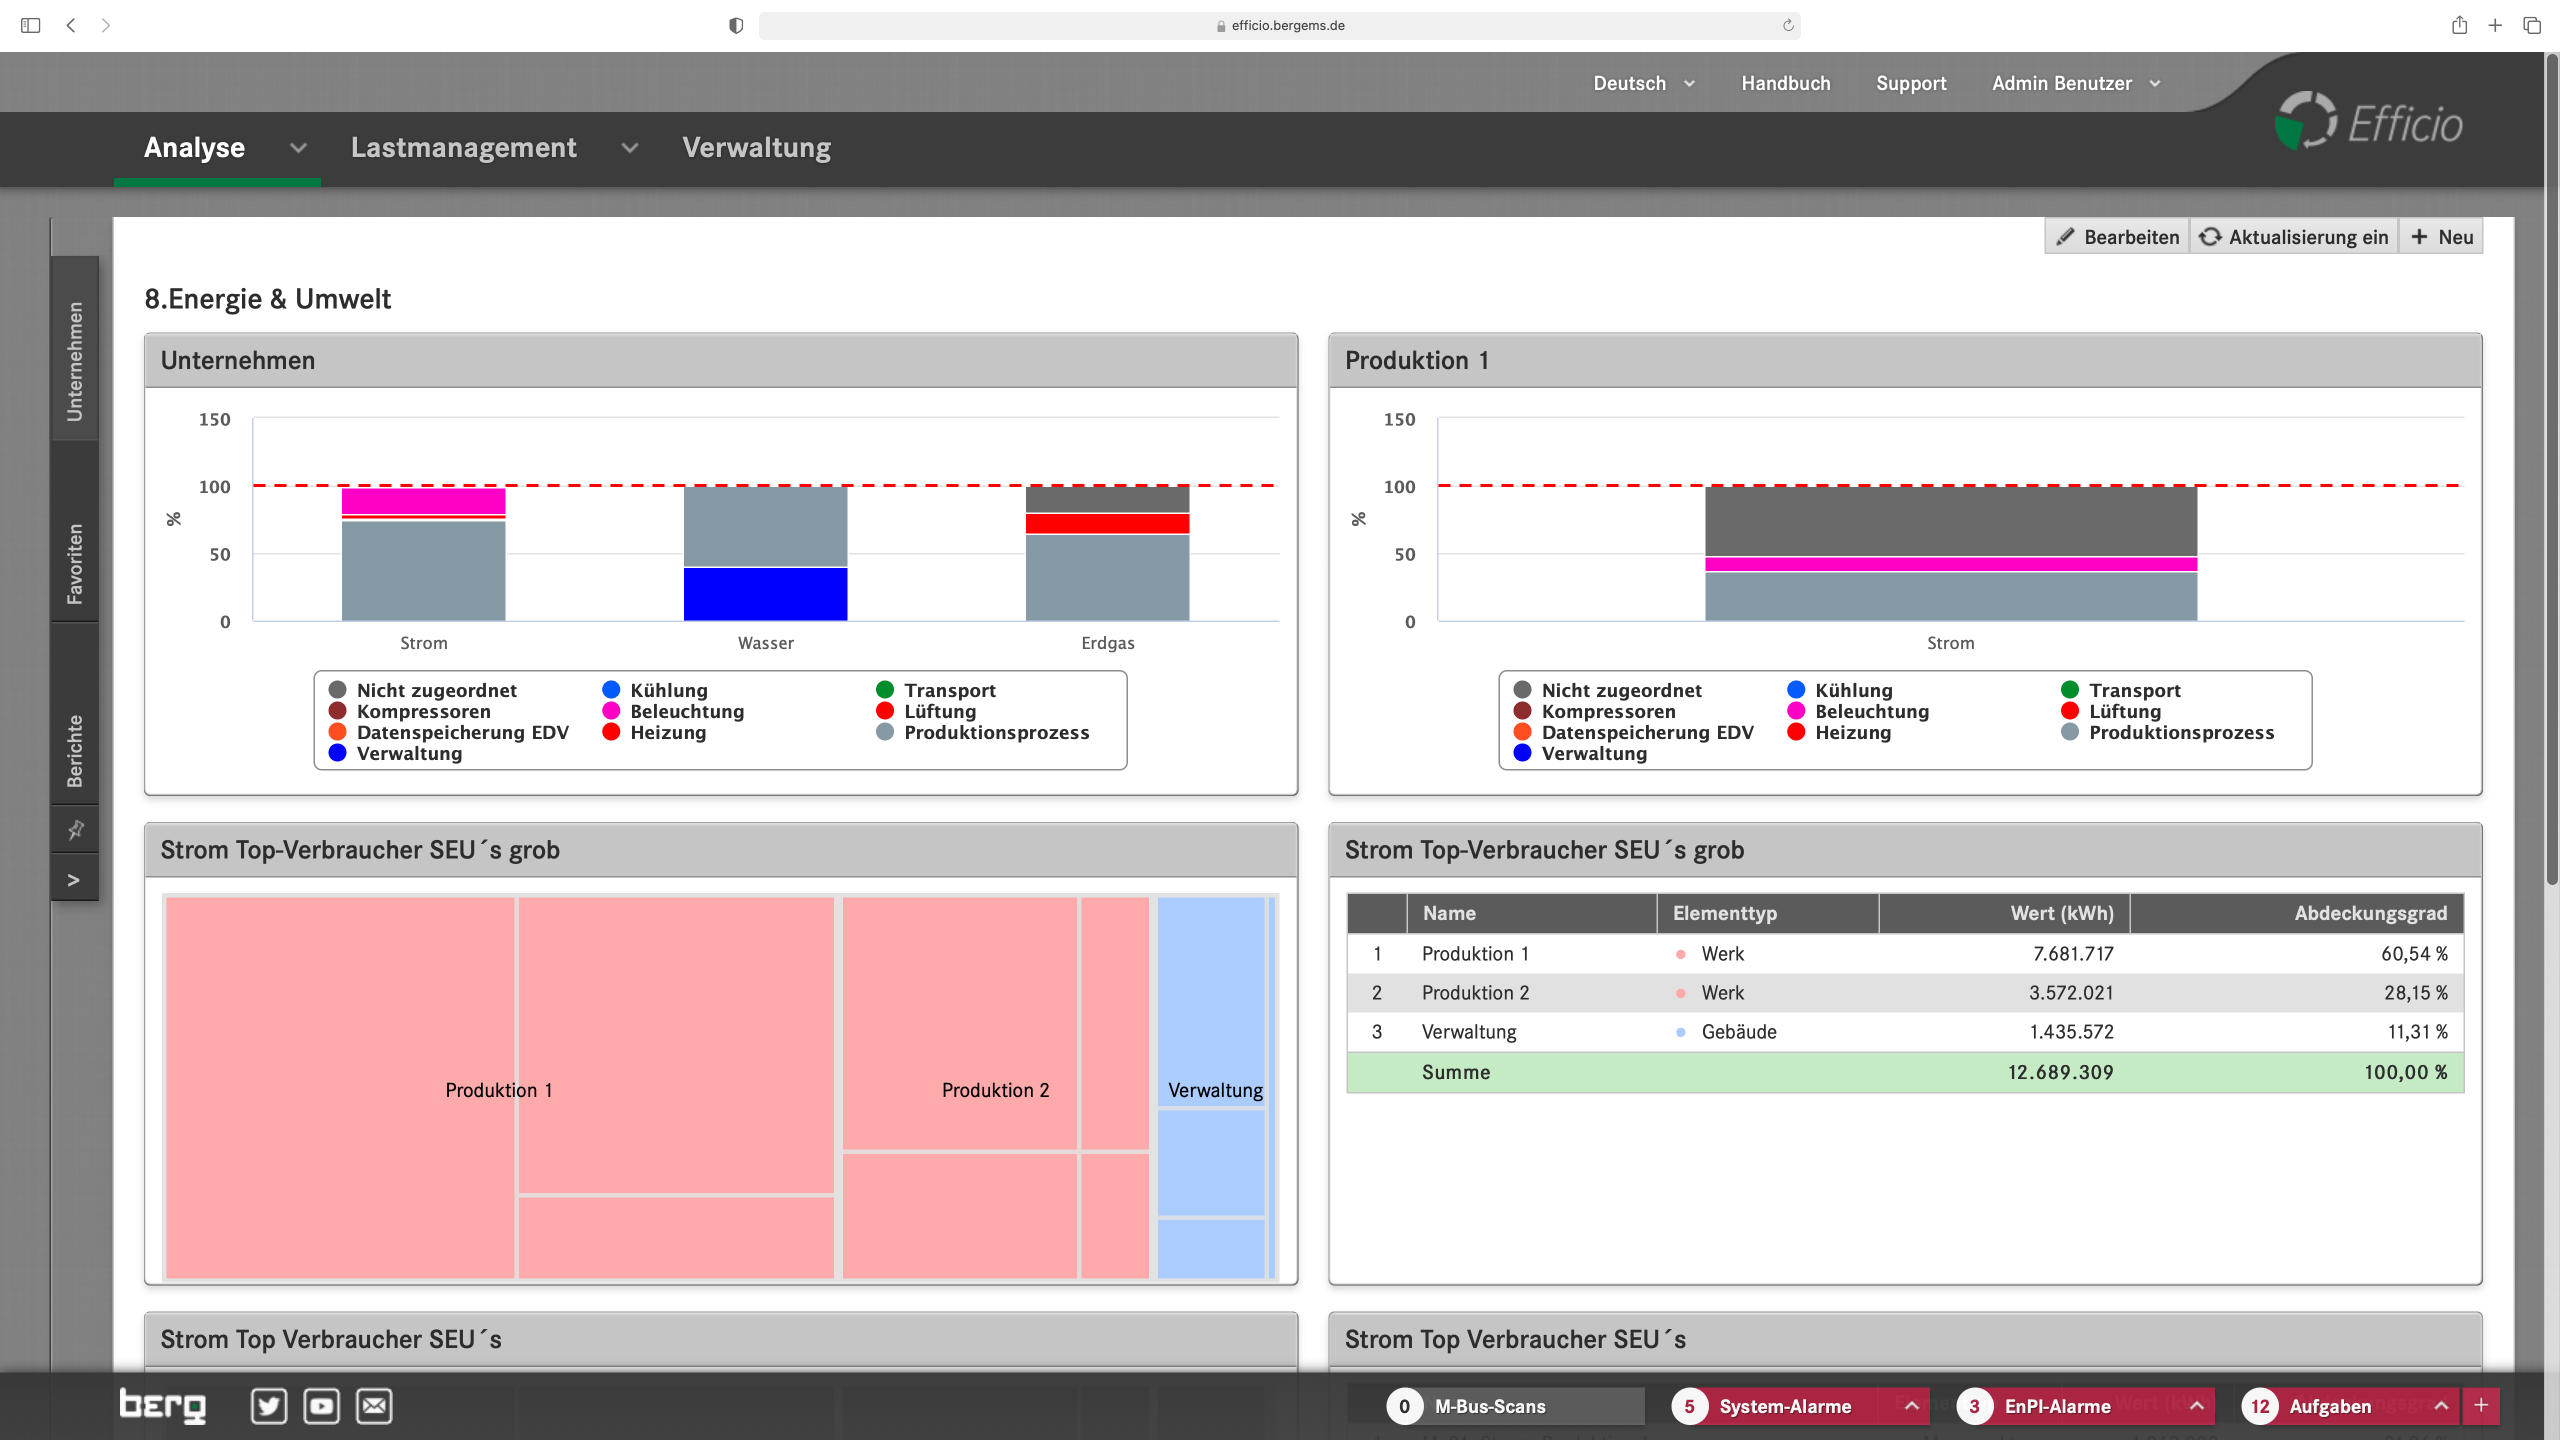
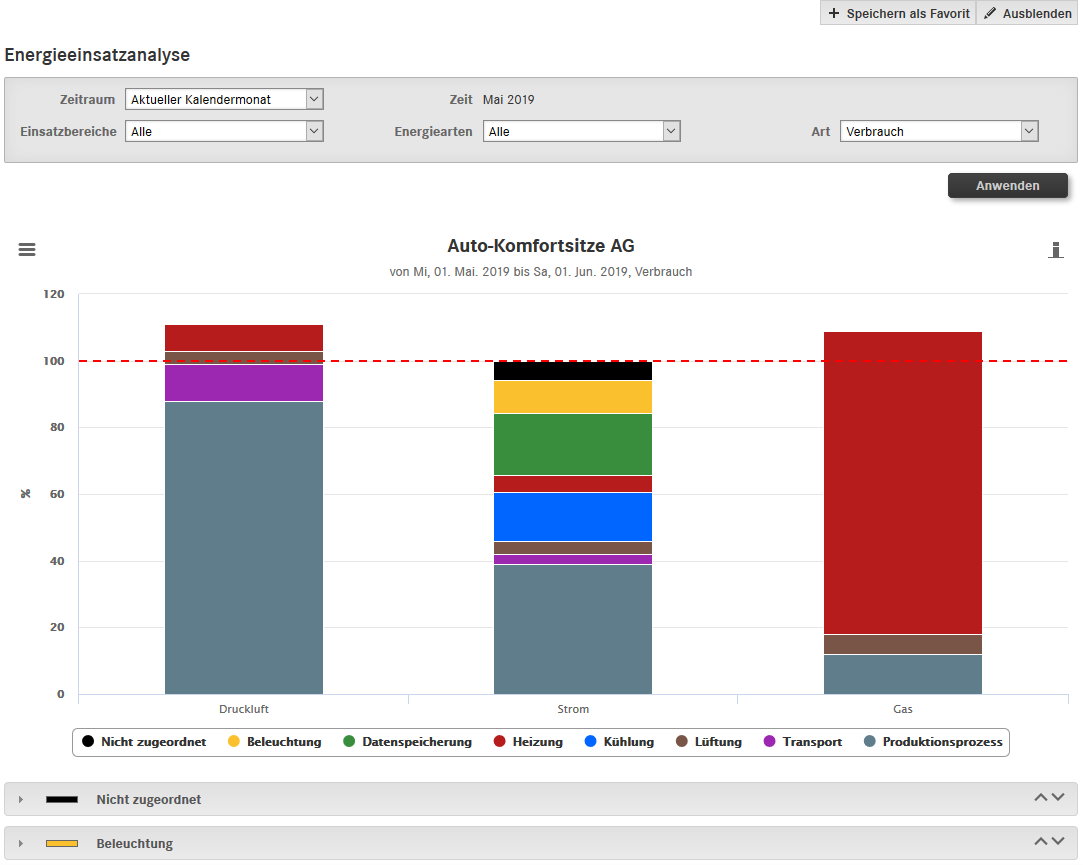
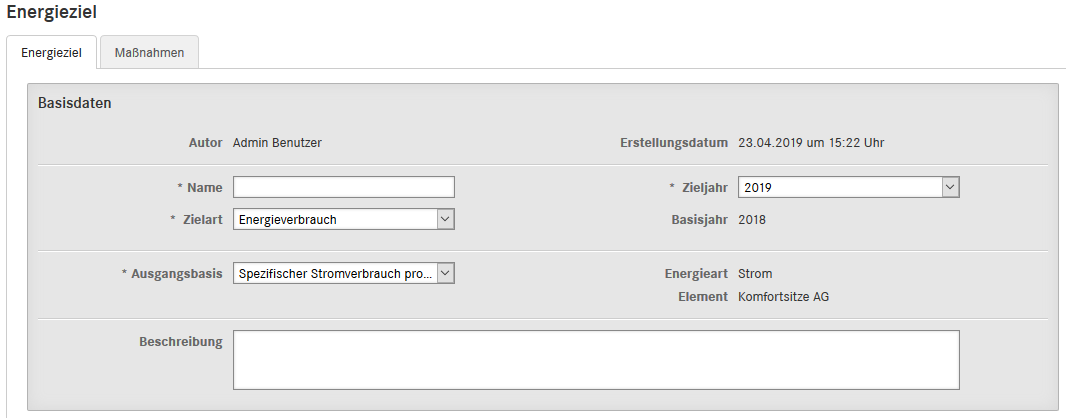
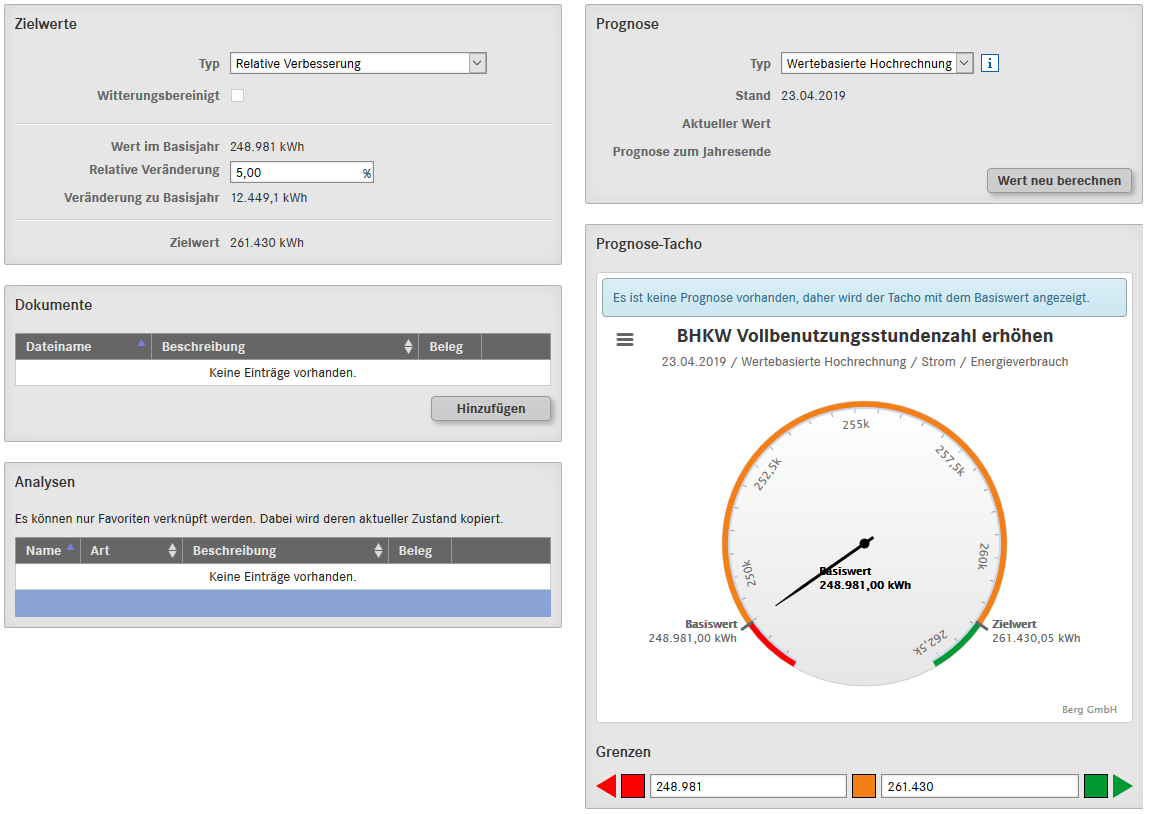
Energy & Environment module
- (Re)certification with the push of a single button
- Set and achieve strategic, organizational, and operational energy targets
- Present, implement, and evaluate measures
- Calculate profitability using ROI, break-even point, and amortization
- Simplify team collaboration
- Mapping and implementation of the PDCA process
Further screenshots

Sankey diagrams
- Visualize energy flows in the form of consumption quantities, cost, or CO2 quantities from feed-in/generation to the last consumer
- See how much energy, water, or other auxiliary materials are currently required by which production facilities
- Automatically map energy flows from the individually constructed topology (hierarchy, company tree)
- Bands proportional to quantity help you visualize in a comprehensible, transparent, and descriptive way who the current major and minor consumers are
- Identify priorities where savings measures have the greatest effect
- Important component of the ISO 50001 reporting system
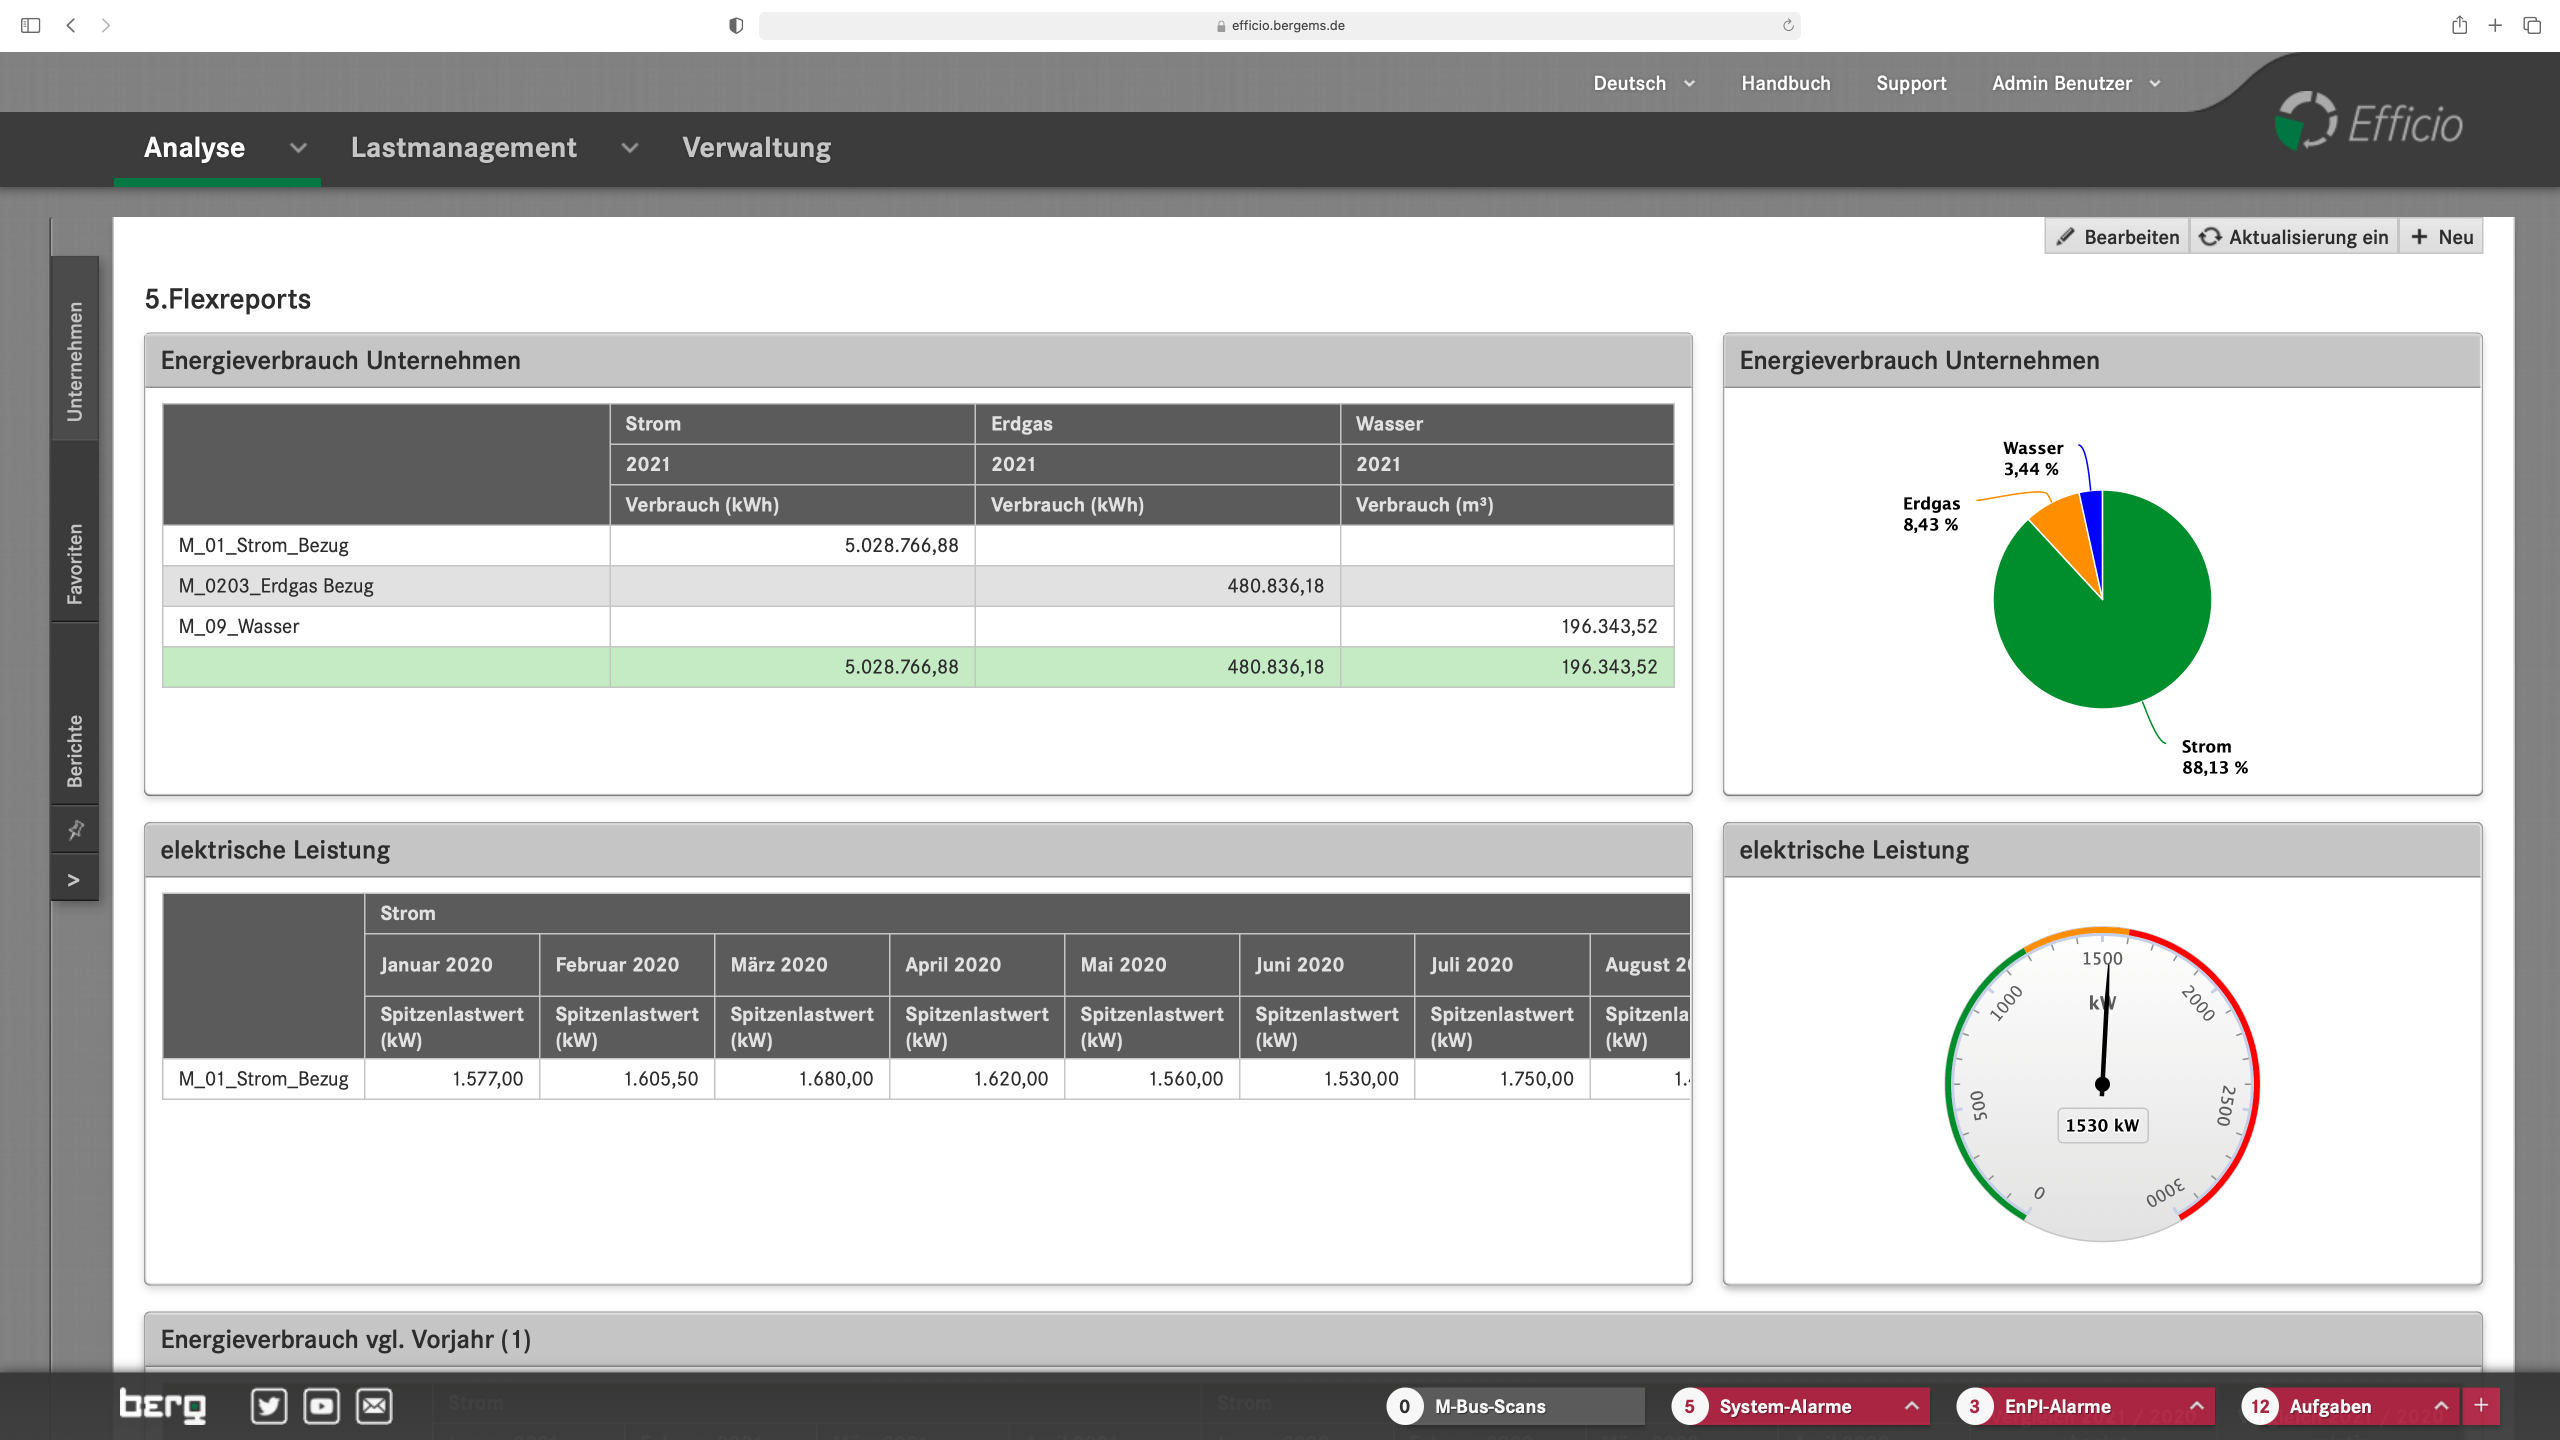
Flexreport
- Design an individual, tabular, and graphical reporting system very similar to Excel with a simple workflow
- Create evaluations for individual real or virtual measuring points for a company element such as a building, production facility, site, or plant
- Report templates are automatically and periodically (finely adjustable) filled with current values and can be automatically distributed to various recipients
- Each Flexreport can be easily filled with data from freely selectable observation periods and can be exported to Excel if desired
- Graphically prepare data from selected rows or columns as lines, bars, pie, or speedometer graphs
- Automatically import exported Flexreports into other expert systems at the company – e.g., for internal cost distribution
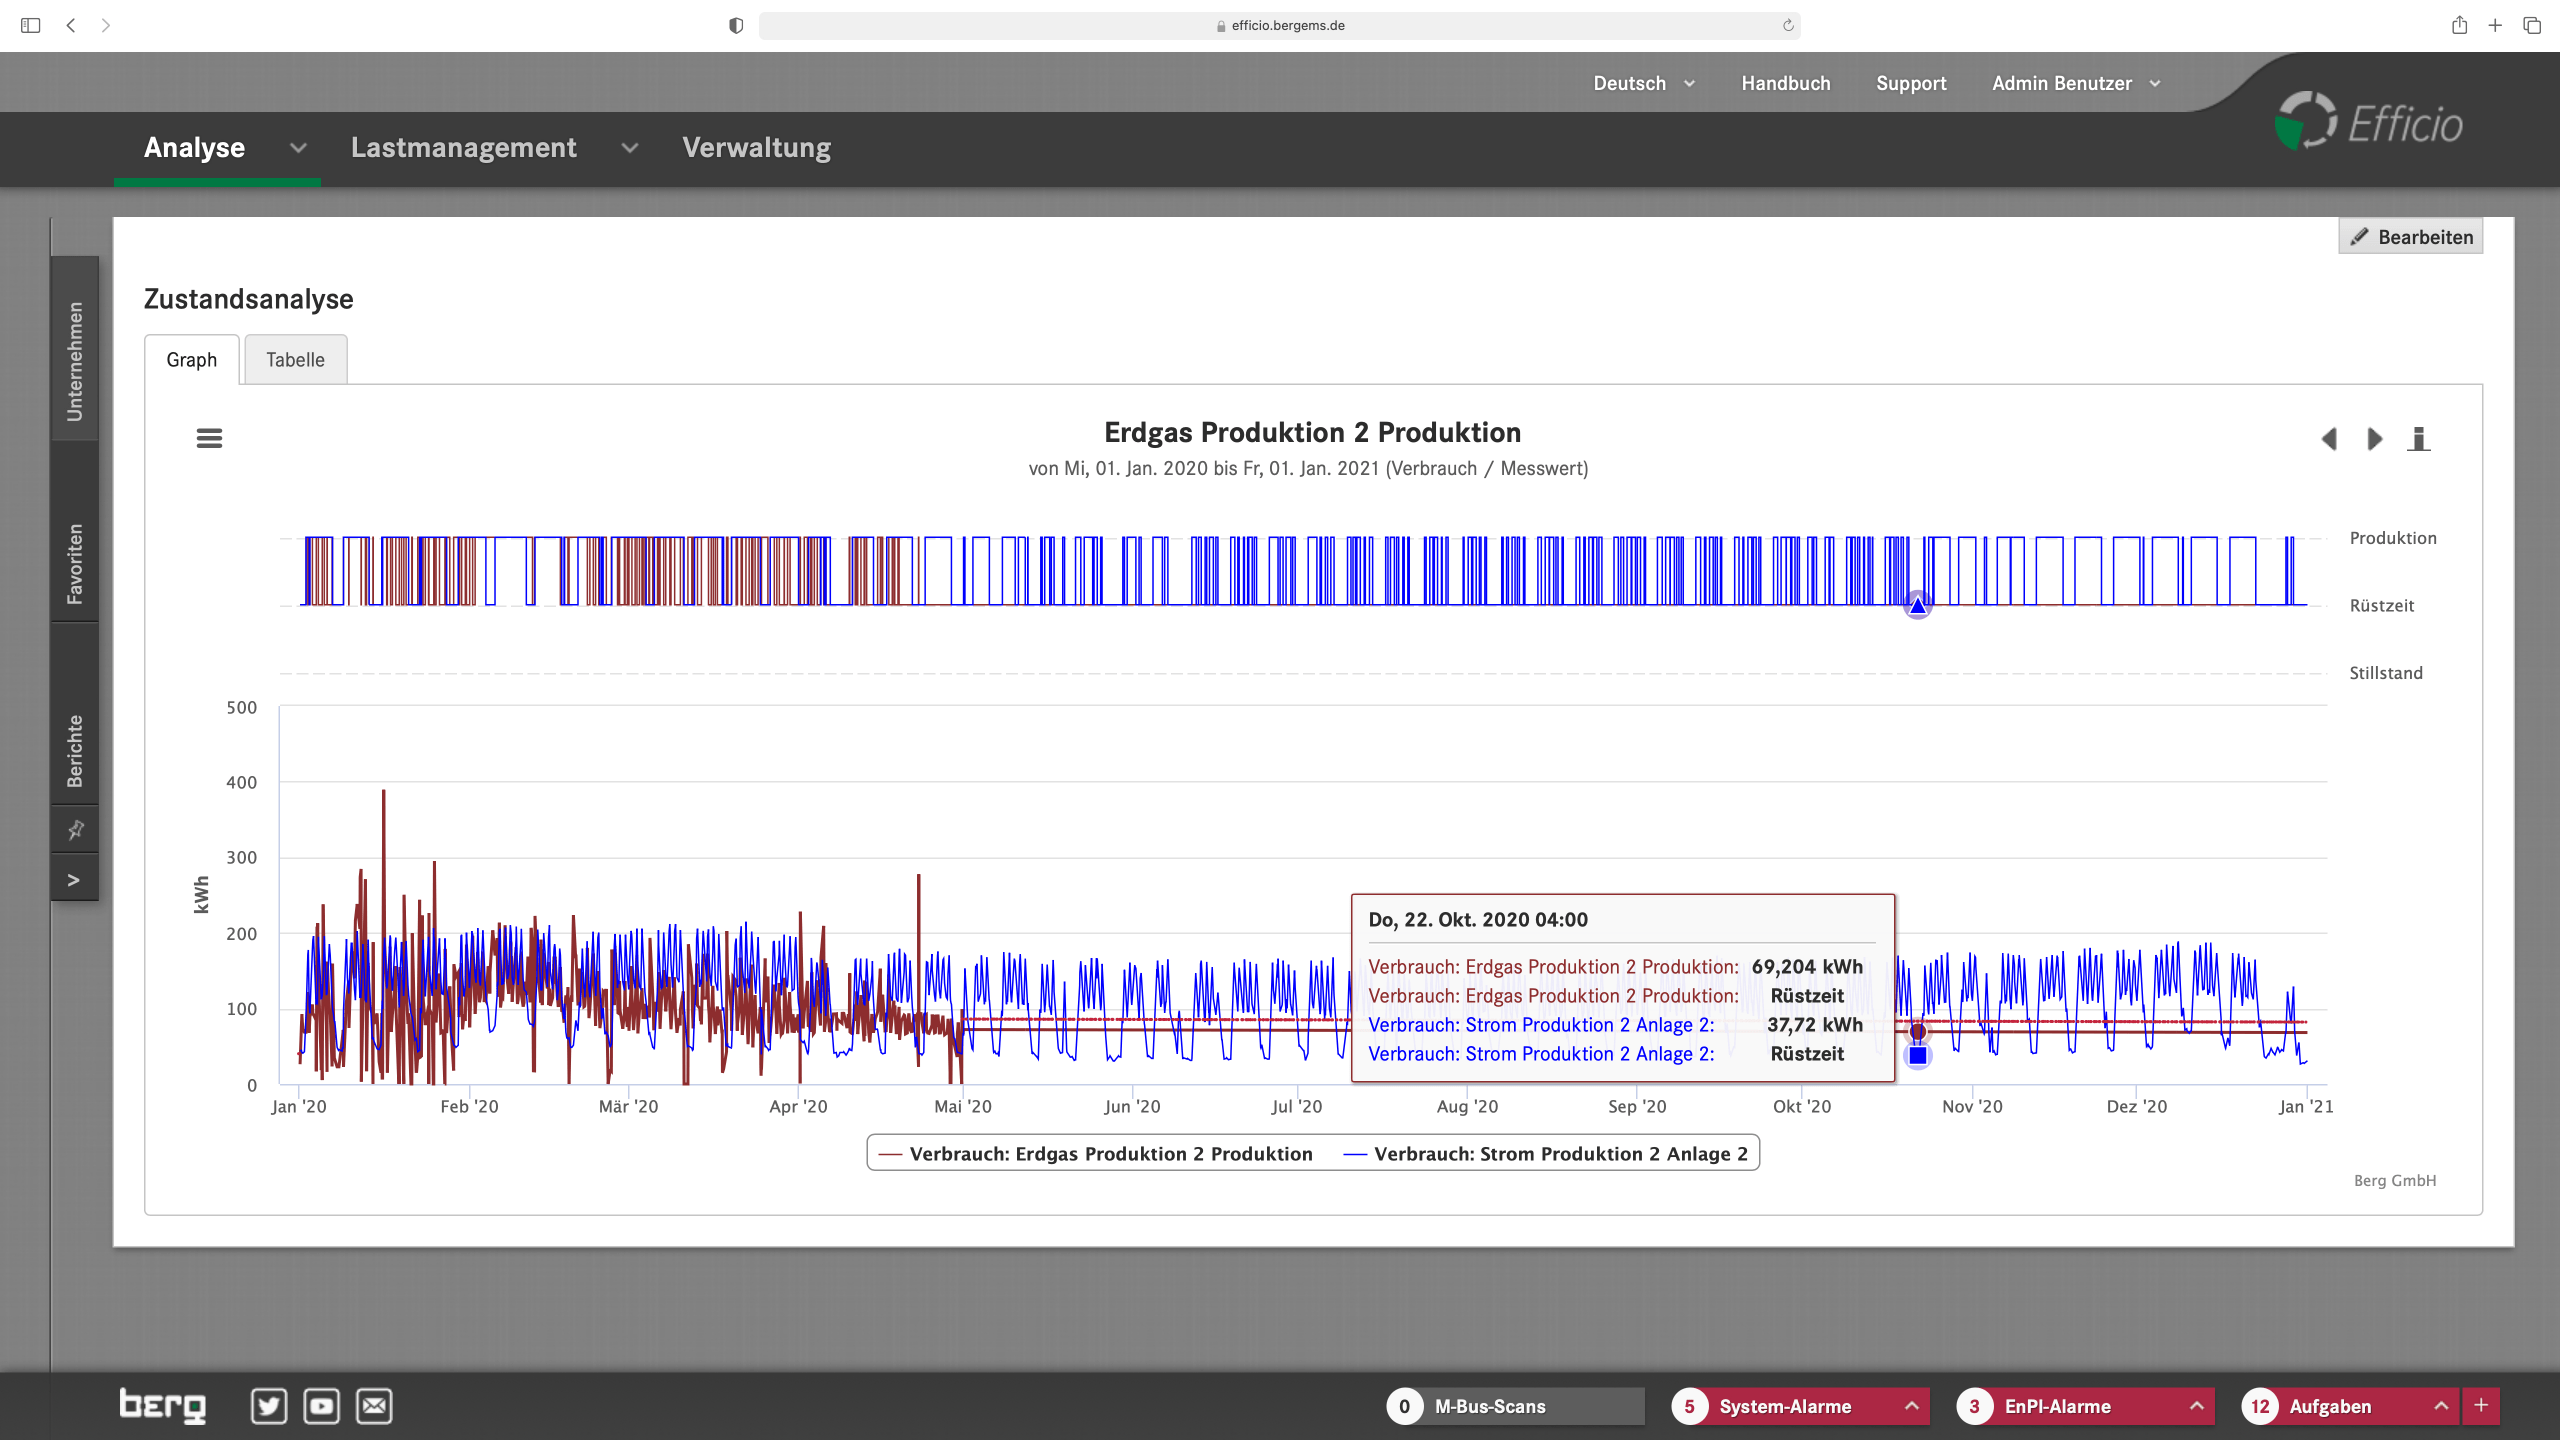
Status analysis
- Automatically derive states and limit ranges from individual measurements and evaluate them separately
- Analyze standby behavior, plant states, operating states, and climate zones
- Answer questions such as How long did which condition last during which time period? What costs did this condition generate during this time period?
- Detect gradual changes and avoid failures (preventive wear detection)
- Analyze heating, ventilation, and air-conditioning systems and save costs through adapted behavior
- Relate production rejects to specific operating conditions and their incidence
- Analyze plant efficiencies in different operating phases
- Easily recognize usage behavior: How long was electricity drawn at which charging station during which period?
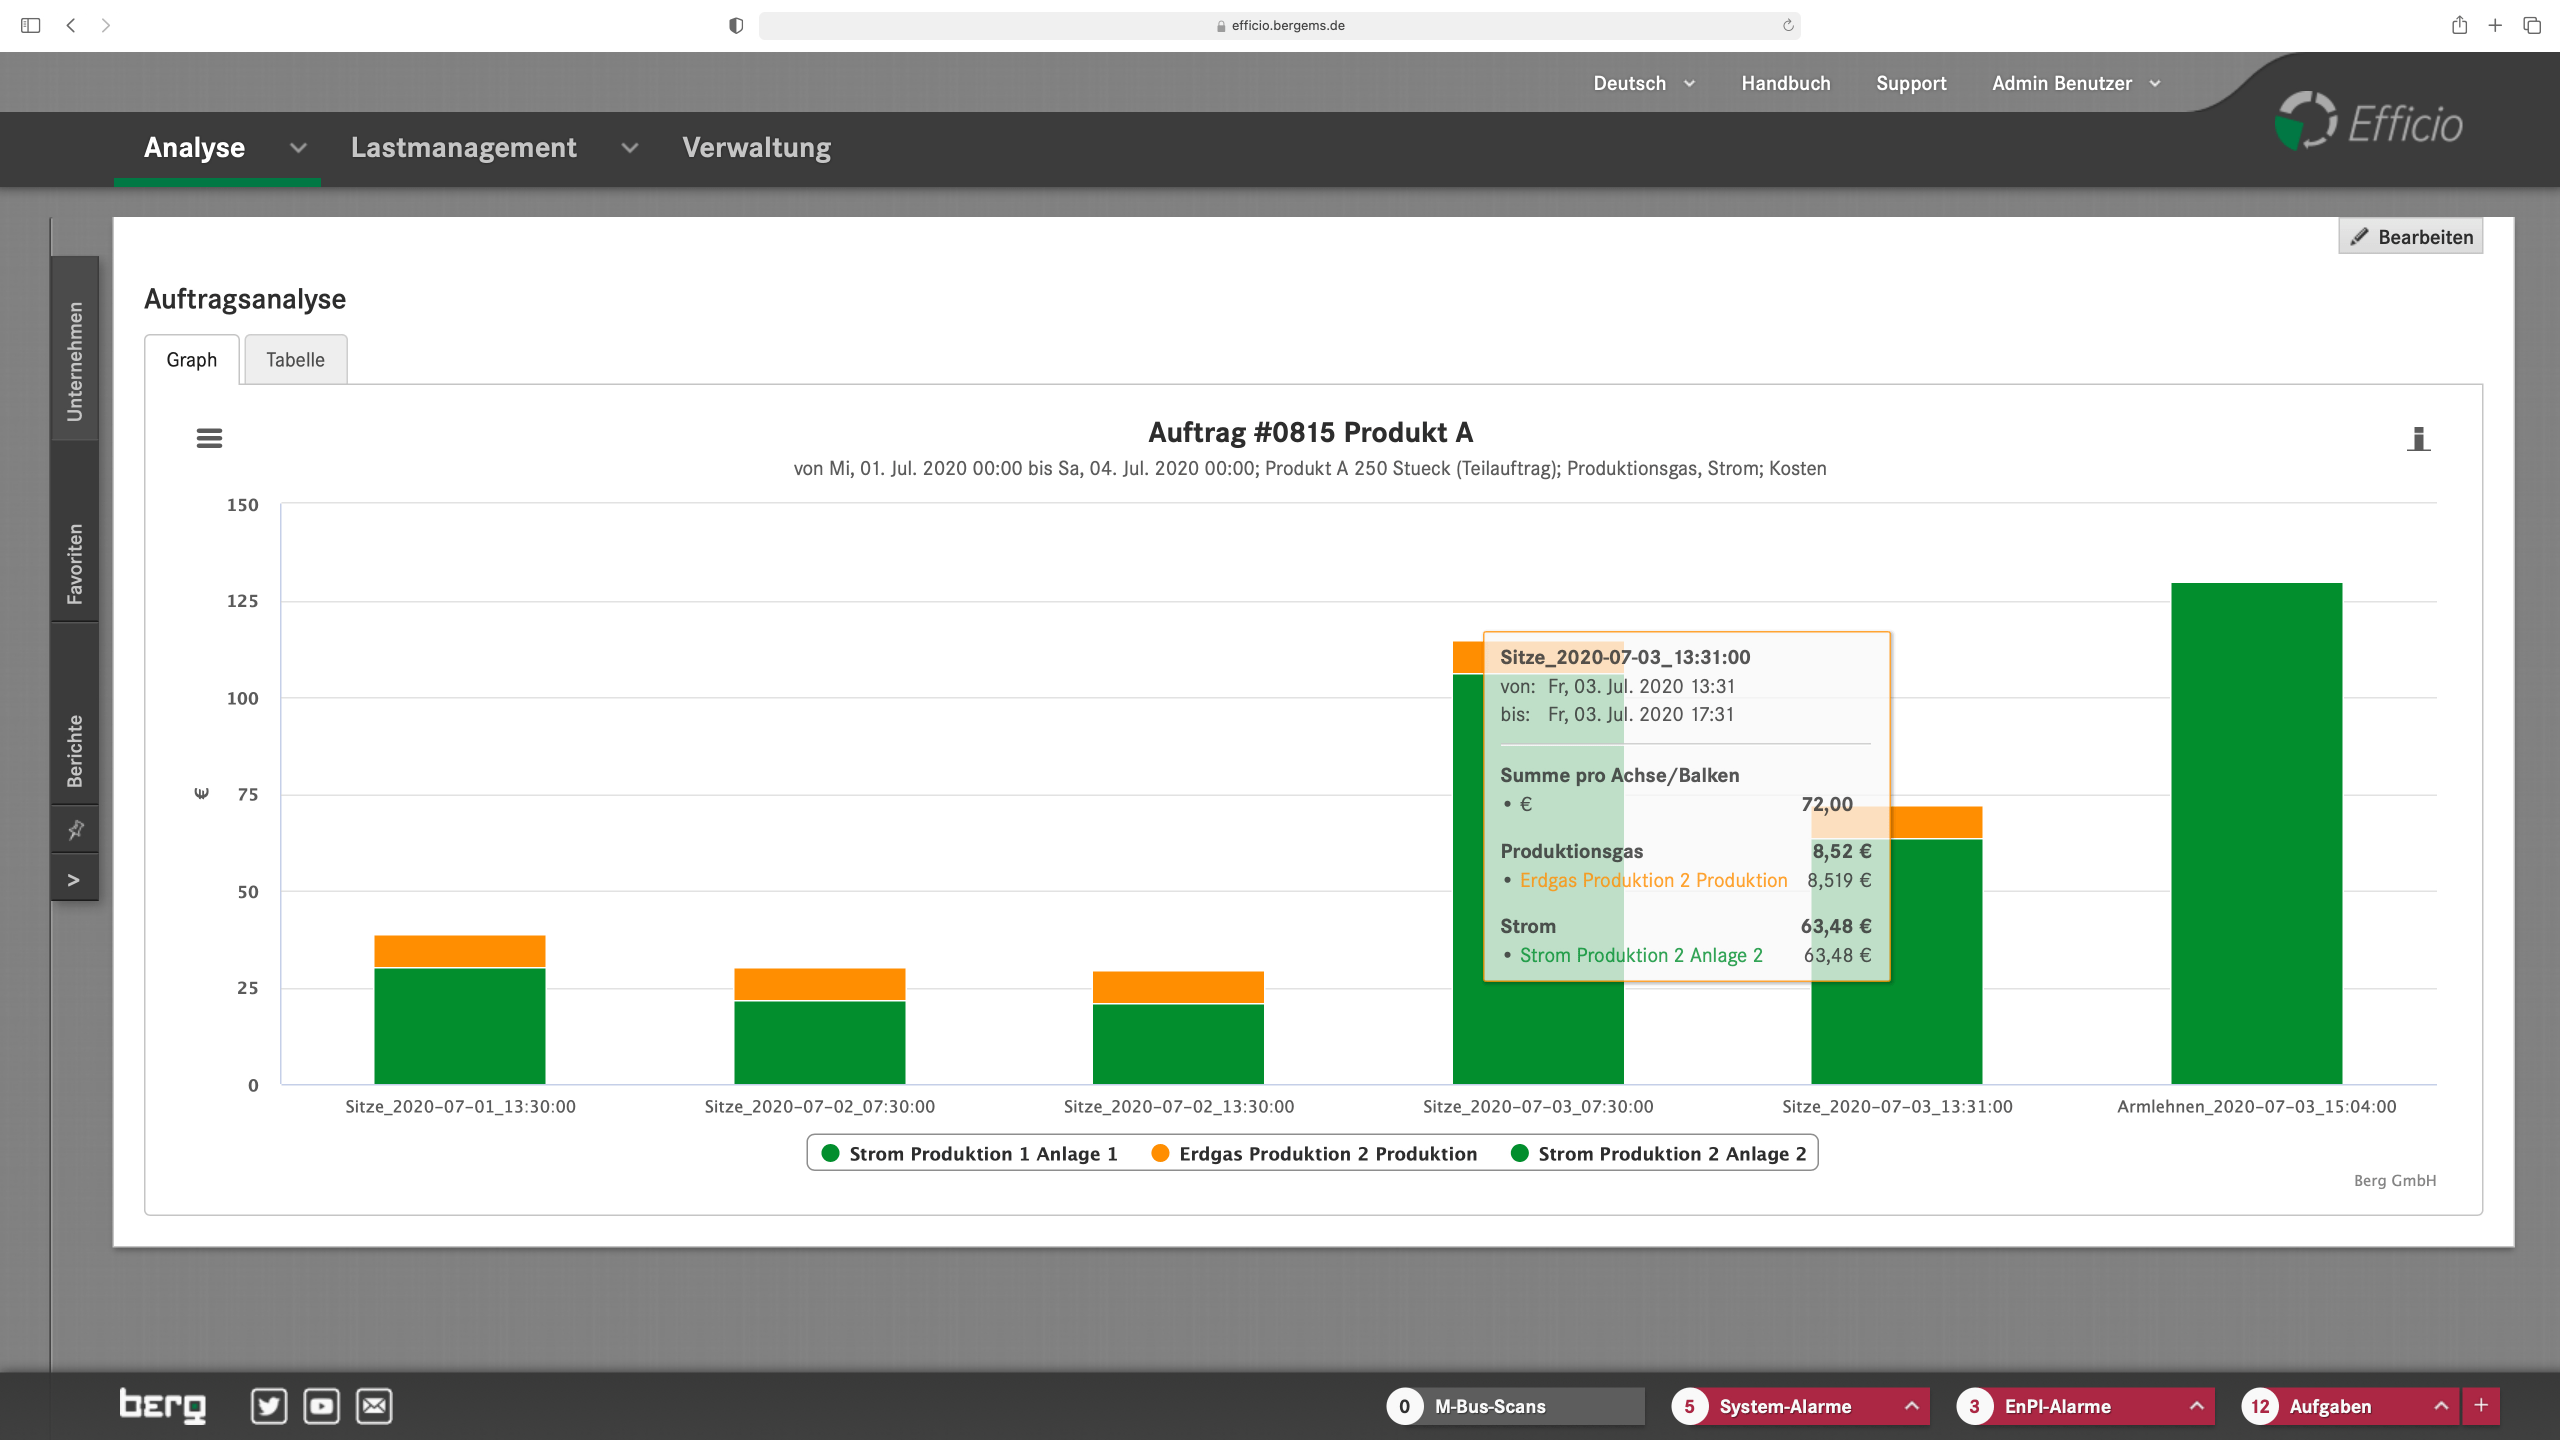
Key order figures (EnPI)
- Calculate the amount of energy or costs needed to produce a product
- Summarize energy quantities and production times of different plants and measurements depending on the order
- Analyze energy consumption of individual work steps and combine them to see the total energy consumption for all required work steps
- Monitor key order figures and display them in dashboards
- Show relative consumption or cost quantities of individual work steps per medium in stacked bar charts
- Analyze partial orders
- Summarize variable cost blocks for billing purposes, such as occupancy of charging stations, trade show booths, shipping docks, etc.
Example of key order figures

Flowcharts
- Freely position consumption, costs, load values, or CO2 emissions on aerial photographs, road maps, plant schematics, overview images, etc.
- Use arbitrary background images to visualize location-dependent measurements
- Nest flow sheets to drill down from an overview to a detailed view
- Visualize instantaneous consumption or generation quantities – e.g., on a screen displaying photovoltaic system showing instantaneous power and generation quantity per unit of time
- Inform employees and customers about own energy savings
- Show flow diagrams in full-screen mode on entrance or hall monitors
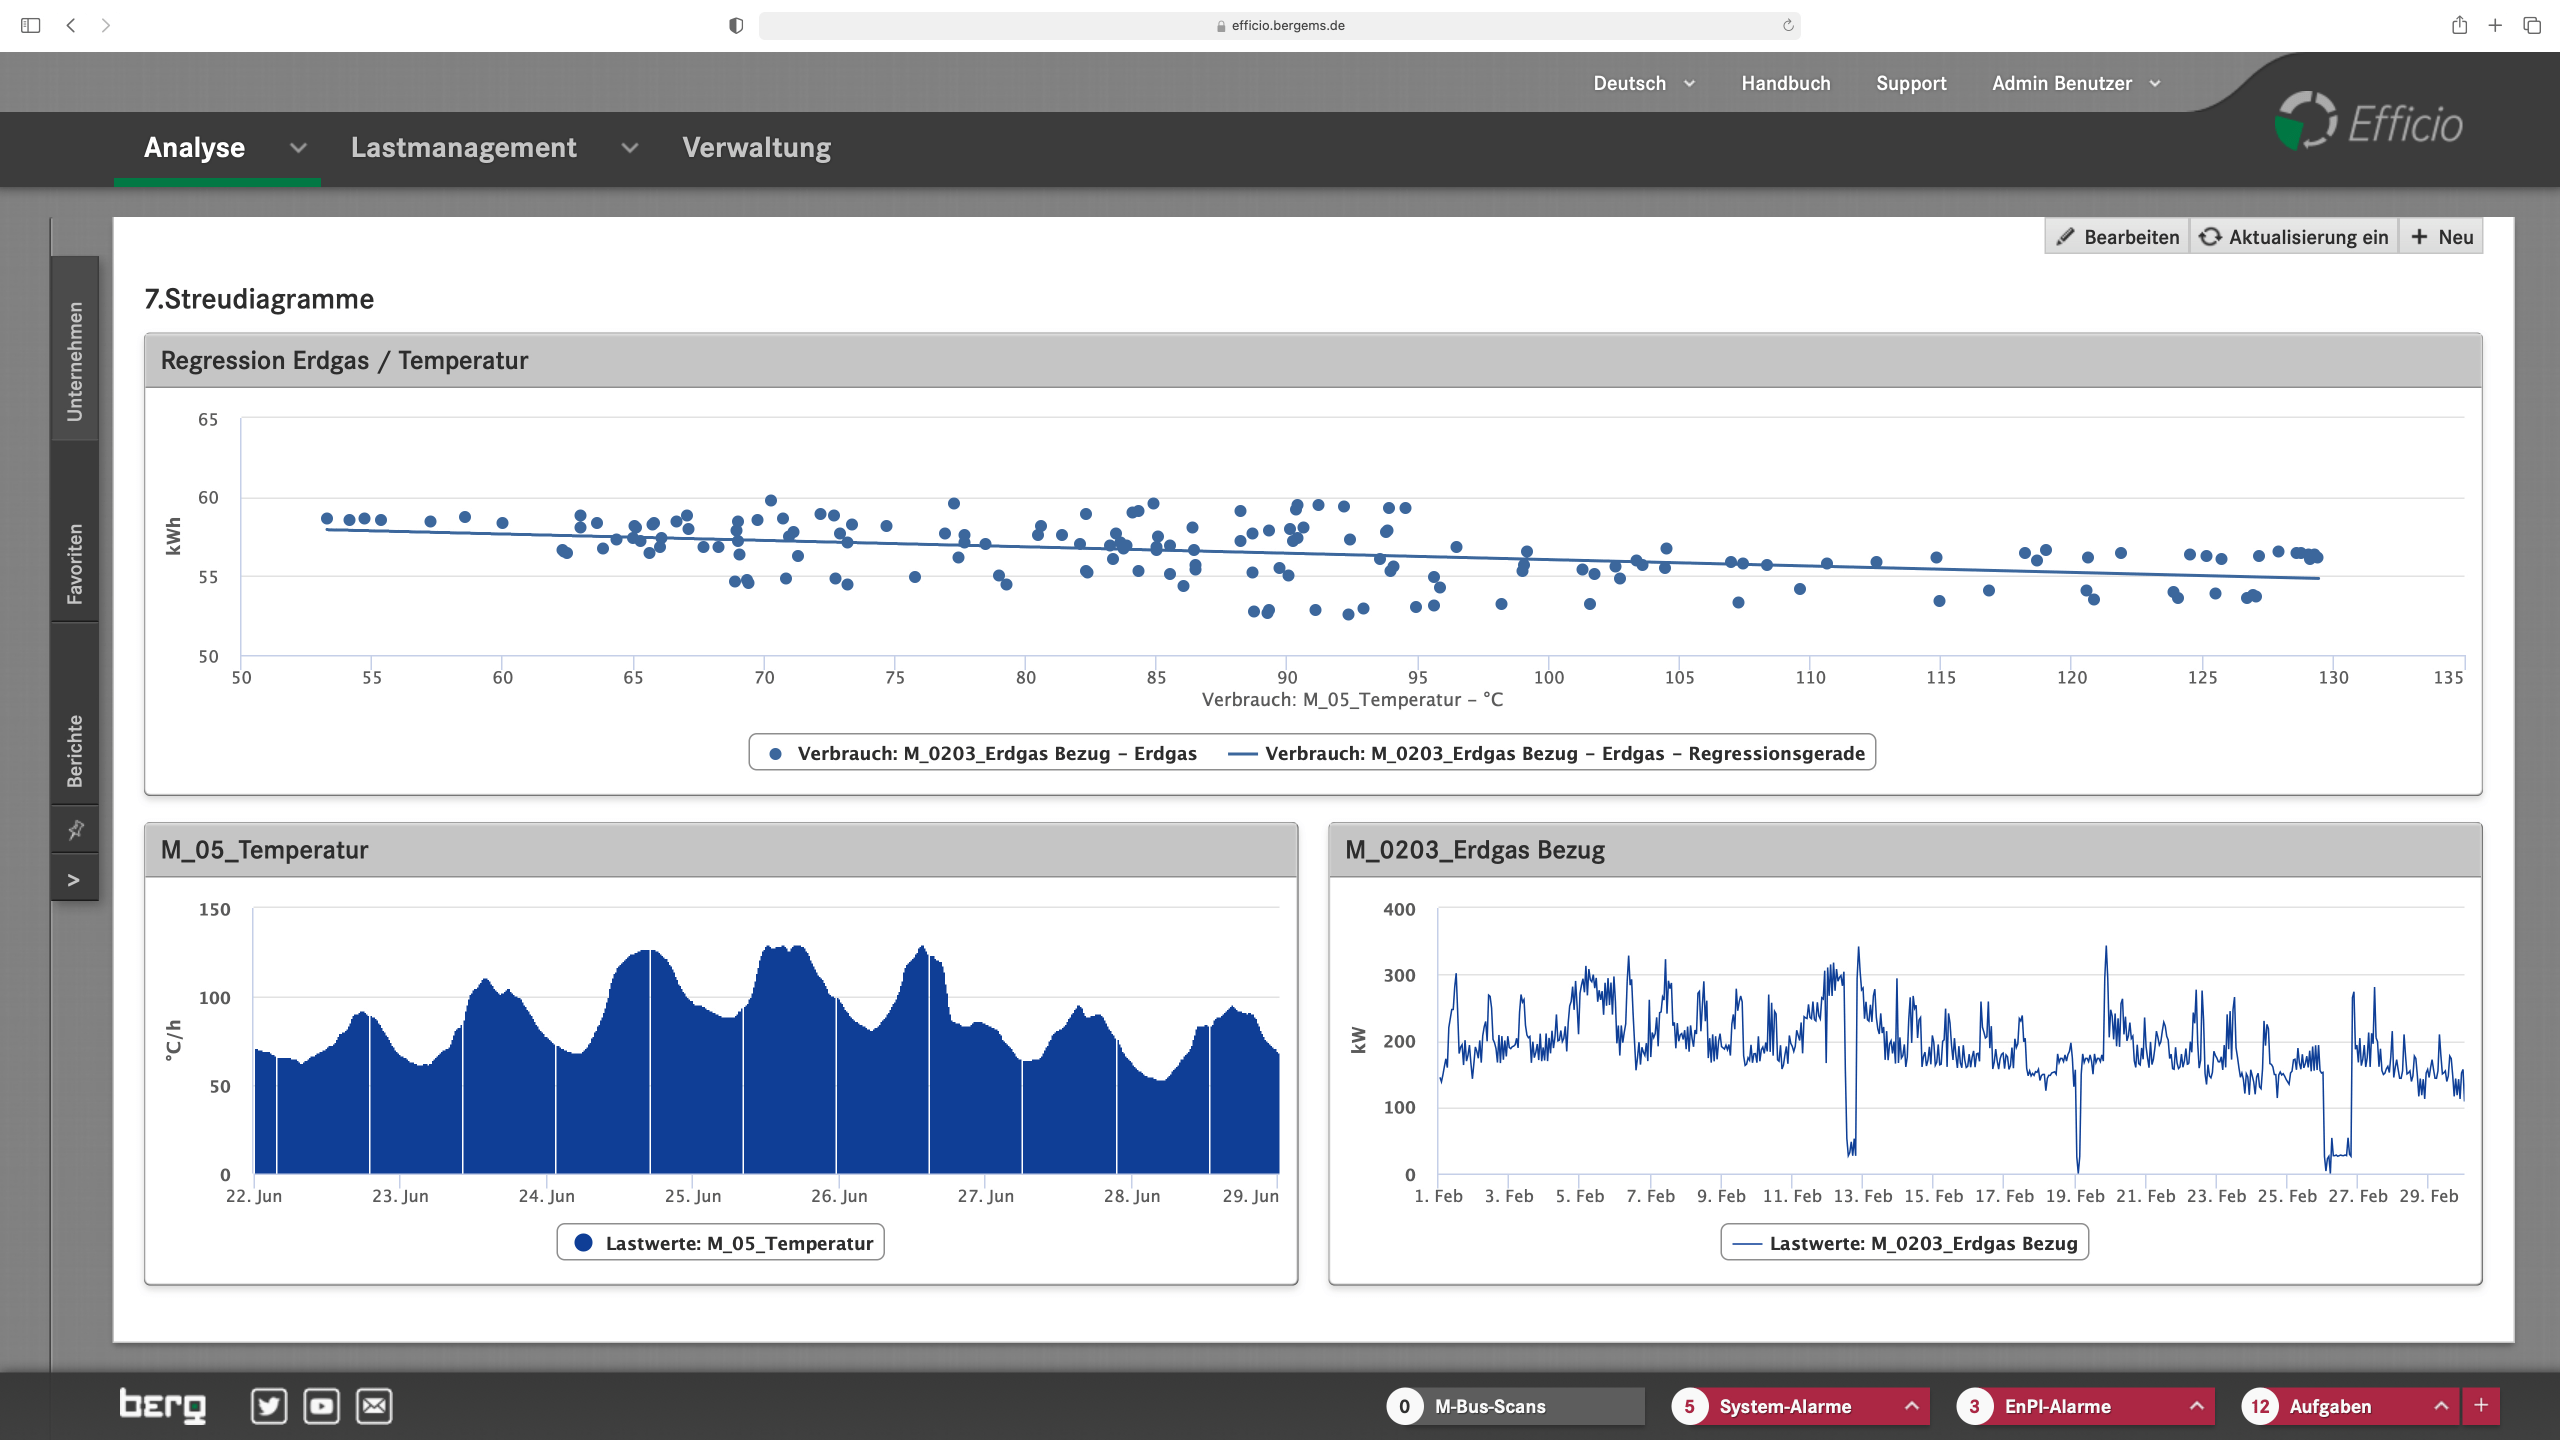
Scatter plots with
regression analysis
- Immediate visual recognition of conspicuous correlations
- Display coefficient of determination R² according to ISO 50006
- Analyze interdependencies among measuring points with display of xy-plots
- Integrate regression analyses into reporting
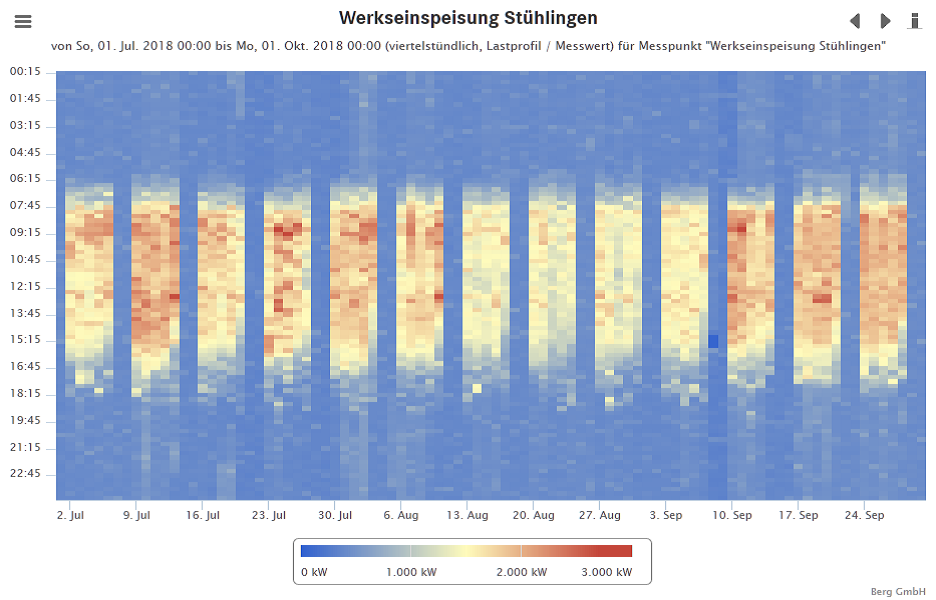
Heatmap
- Immediately recognize conspicuous hot spots visually from a large number of measurements
- Adapt color spectrum to measured values to increase significance
- Scroll through time to compare with previous time periods
- Analyze hot spots in terms of when they occurred and their frequency
- Detect leakages
- Recognize unusual consumption behavior during off-peak periods
- Compile heat maps (spectral analyses) in dashboards to monitor many areas very quickly
- Incorporate spectral analyses into regular reporting
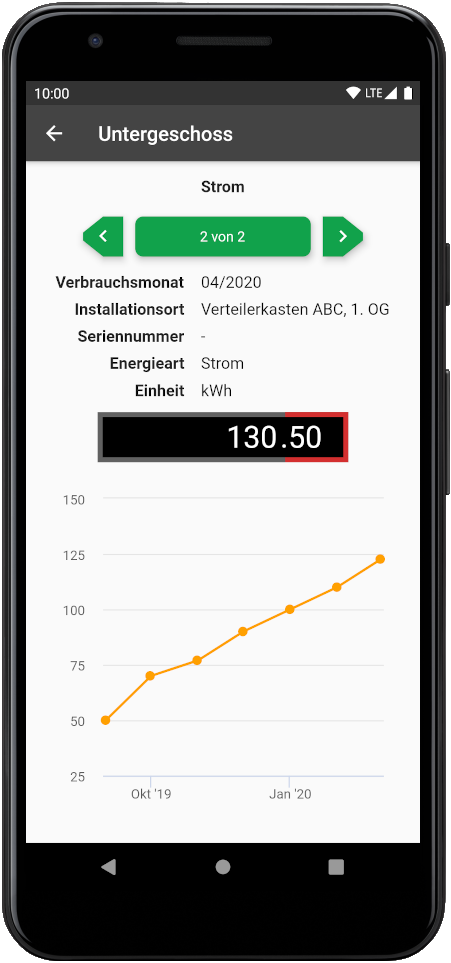
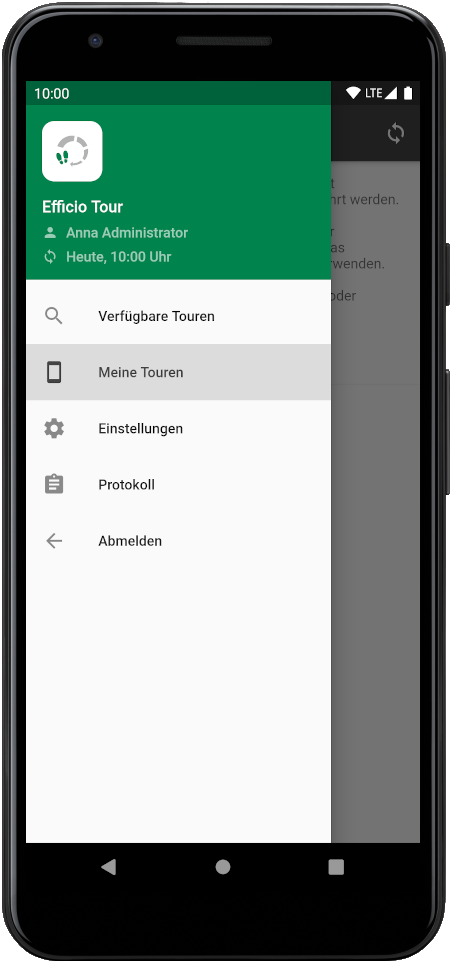
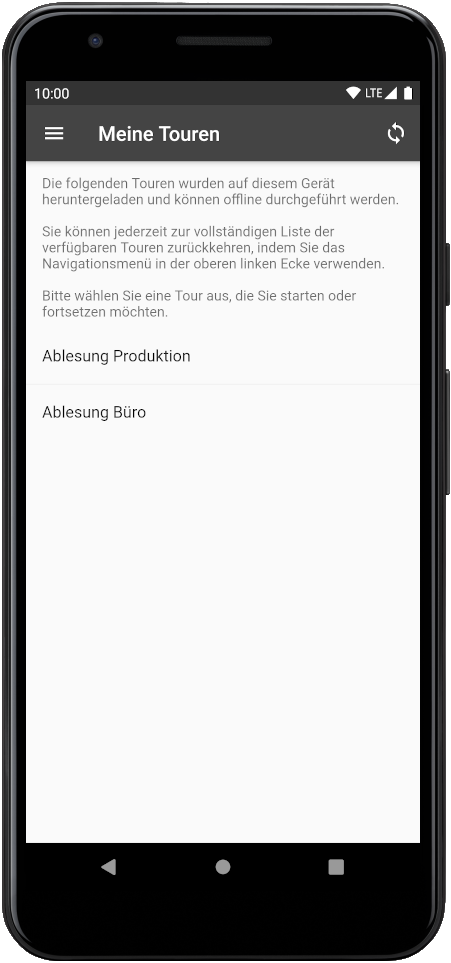
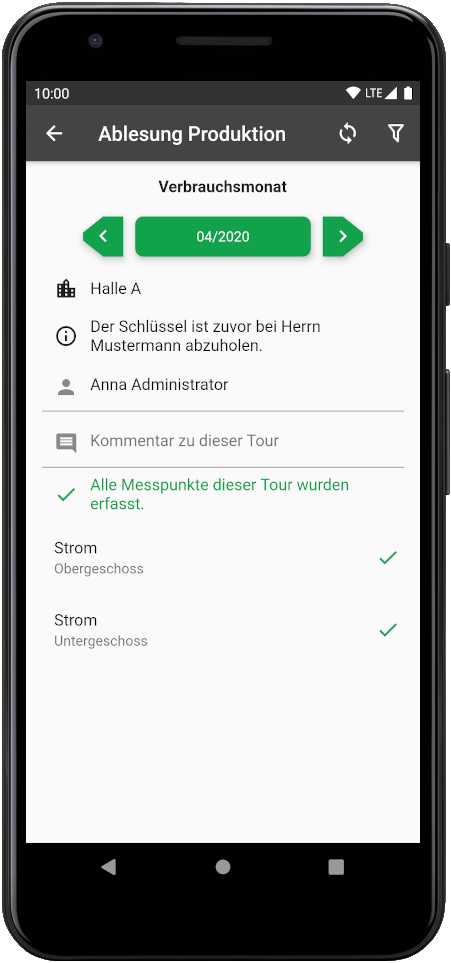
Efficio Tour app
- Support manual reading of meters during tours with mobile device (smartphone/tablet)
- Graphically visualize last seven readings to quickly identify incorrect readings or unknown meter changes
- For daily readings, the ability to visualize a whole month – data from the last 30 days are saved
- Fast and automatic synchronization via Wi-Fi
- Quickly ascertain the completeness of the tour, change the order as desired, and enter readings subsequently
- Very clear number display and input keypads
- No error-prone noting of readings with pen and paper
- Meter readings can also be taken offline (without mobile phone reception)
- App available for Android and iOS smartphones and tablets
Further screenshots of the Tour app